North slope of Mauna Loa, as seen from Mauna Kea. Click here
or on image for bigger picture.
(Courtesy of USGS, Hawaiian Volcano Observatory, photo by D. Little)
[More USGS images of Hawaii]
North slope of Mauna Loa, as seen from Mauna Kea. Click here
or on image for bigger picture.
(Courtesy of USGS, Hawaiian Volcano Observatory, photo by D. Little)
[More USGS images of Hawaii]
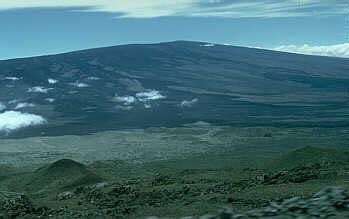
Mauna Loa (above) is one of the shield volcanoes that make up the Island of Hawaii. This photograph was taken from the south flank of Mauna Kea, which is another one of the shield volcanoes that make up the island. Note the gently sloping flanks of of the shield. The Island of Hawaii represents the largest volcanic structure on the Earth, and perhaps the second largest volcanic structure in the solar system. There is an even bigger shield volcano, Olympus Mons, on Mars. As already noted in the introduction to this exercise, the source of the magma for this enormous outpouring of basaltic lava is the asthenosphere above a mantle plume (hot spot). The terms, mantle plume and hot spot, are used synonymously to describe a localized, upwardly convecting blob-like mass of hot mesospheric mantle. Above such structures, the asthenosphere is unusually hot and pushed close to the surface, creating the ideal situation for the production of enormous amounts of basaltic magma.
For practical purposes, these mantle plumes remain fixed in place in the mesosphere (mantle below the asthenosphere) for long periods of geologic time up to 100's of millions of years. By comparison, tectonic plates can move at blinding speeds of up to 20 cm/year. Well, that doesn't sound too blinding, but over the course of 100 million years this amounts to 2 billion cm of movement, or 20,000 km (12,400 miles). Basically, no sooner does a shield volcano form than it is carried away by the movement of the plate on which the shield volcano is formed. Let's look at the consequences of this process. Here is a map showing the locations of shield volcanoes and what used to be shield volcanoes (before they were eroded), produced over the Hawaiian hot spot, which is situated beneath the southern part of the Island of Hawaii.
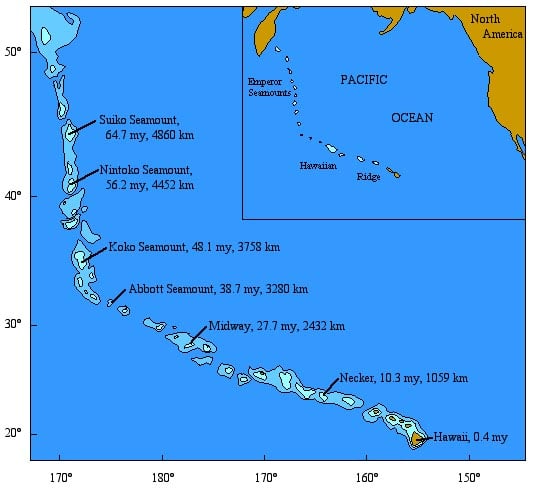
All that remains of most of the former shield volcanoes are completely submerged seamounts. The map gives the ages of selected islands and seamounts, and their distances from the Island of Hawaii.
1.1 Notice that the islands and seamounts are aligned along what are referred to as the Hawaiian Ridge and Emperor Seamounts. What compass direction is the Pacific Plate currently moving? Pick the closest compass direction from N, NE, E, SE, S, SW, W, NW.
1.2 For approximately how long has the Pacific Plate been moving in this current direction?
1.3 The Emperor Seamounts are aligned along a different, more northerly, trend. What does this mean with regard to the movement of the Pacific Plate since the beginning of the Cenozoic Era about 65 million years ago?
Using the information given on the map, it is a simple matter to calculate the rate of movement (velocity) of the Pacific Plate. Remember, a velocity can be calculated if you know the distance traveled and the time it took to make the "trip," according to the following formula:
velocity = (distance traveled) / (travel time),or more simply, v = d / t.
1.4 Consider Necker Island, which is 1059 km away from
the Island of Hawaii and is 10.3 million years old. What has been
the velocity of the Pacific Plate for the past 10.3 million years, in km/million
years? in cm/year?
(NOTE: 1 km = 1000 m; 1 m = 100 cm; 1 million years = 1,000,000 years.)
We can actually explore such velocity relationships in a more interesting way. Take a look at this diagram, which plots distance (vertically) versus age (horizontally).
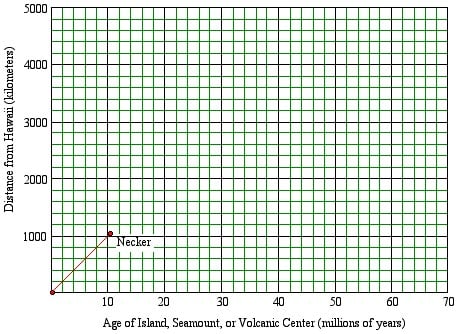
Plotted on the diagram is a spot corresponding to the distance from Hawaii and age of Necker Island. You note that the slope of the segment connecting the origin to the spot for Necker gives the velocity that you just calculated. On the copy of the graph, that has been distributed to you, plot spots for each of the other islands or seamounts for which there are data given on the map. Then connect each spot to the next going from youngest to oldest.
1.5 Notice that the segments connecting adjacent spots have different slopes. Consider the velocity of the Pacific Plate for the interval of time between the ages corresponding to adjacent spots. Look at the slope of the line segment connecting the adjacent spots. Has the velocity of the Pacific Plate always been what it has been for the past 10.3 million years? What does a steep slope mean? What does a gentle slope mean?
1.6 In the past 50 million years, during which interval of time was the velocity of the Pacific Plate the slowest?
1.7 What was the velocity during this slowest interval, in
km/million years? in cm/year?
(NOTE: 1 km = 1000 m; 1 m = 100 cm; 1 million years = 1,000,000 years.)
Now, let's take a closer look at some young shield volcanoes, as exemplified by the Island of Hawaii. Examine the map and cross-section of the Island of Hawaii, given below.
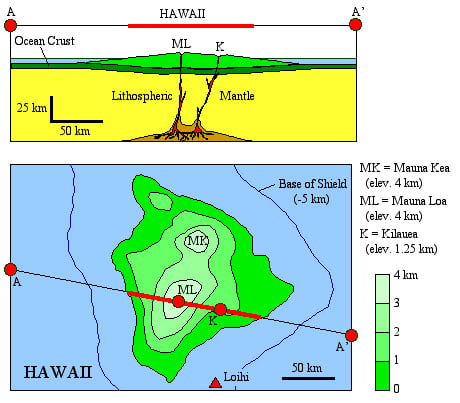
The highest elevations on the Island of Hawaii are on Mauna Kea and Mauna Loa, the tops of which are both about 4 km above sea level. The base of these shield volcanoes is at a depth of about 5 km below sea level. Thus, the total relief of the volcanoes is about 9 km (almost 30,000 ft). The cross-section (above) gives an impression of how much of the shield structure is actually below sea level. The cross-section also shows how gentle the slopes are on the flanks of the shield structure.
The slope of the surface of a volcano is related to the physical characteristics of the material composing the surface. The very low viscosity of basaltic magma produces very gentle slopes, and this is characteristic of the shape of a shield volcano. So now, let's try to get an impression of just how low are the slopes. The slope of a land surface can be measure from information on a map. All that is needed is the horizontal distance between two points on landscape, and the difference in the elevations of the two points. The difference in elevation is called relief. The slope of a surface between two points on a map, say X and X', where the elevation at X' is greater than the elevation of X, is given by the following equation:
slope = (difference in elevation between X' and X) / (horizontal distance between X and X'),or more simply , slope = relief / (horizontal distance).
The slope can also be reported as the angle, A, that the land-surface makes with respect to a horizontal surface, such that
tan (A) = slope,where the slope is given by the first equation.
1.8 Along the line A-A' in the map above, what is the average slope and angle of the slope between the top of Mauna Loa and the base of the shield to the east? You will have to estimate the relief between the top of Mauna Loa and the base of the shield, and you will have to estimate the horizontal distance between these two points using the scale-bar in the lower right-hand corner of the map. Make sure the units of measure for distance and relief are the same.
If you were on the Island of Hawaii, you could estimate the slope in a different way. The photograph that appeared at the beginning of this section (reproduced below) illustrates the idea.
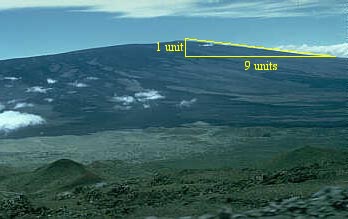
Marked in yellow is a right triangle, such that the hypotenuse (that's the long side) traces the slope of the west flank of Mauna Loa. The relief (difference in elevation) is represented as 1 unit. The horizontal distance is 9 units.
1.9 What is the slope and angle of slope of the flank of Mauna Loa?
For comparison with a stratovolcano, it would be interesting to have a rough estimate of the total volume of basalt in a the shield complex of the Island of Hawaii. For this purpose, we might model the shape of a shield volcano as a simple cone, the volume for which is given by the formula,
volume = (1/3)*pi*r2*h,where pi ~ 3.14, r = radius of the cone, and h = height of the cone. In the case of the Island of Hawaii, the radius, r, may be taken as the horizontal distance (map distance) from the top of Mauna Loa to the base of the shield, to the east along the line A-A' in the map shown earlier. The height, h, may be taken as the relief, from top to base of Mauna Loa. Using these measurements, you can get a rough estimate of the volume of basalt in the Hawaiian shield. Make all your measurements in kilometers.
1.10 What is the approximate volume of the Island of Hawaii, in cubic kilometers (km3)?
YOU HAVE COMPLETED THE FIRST PART OF THE LAB EXERCISE.
PROCEED TO THE NEXT SECTION ON MOUNT ST. HELENS
or
RETURN TO FIRST PAGE