
Introduction: The following lesson involves generating
data using a simple physical science activity and then interpreting this
data using a computer spreadsheet and graph. This activity is appropriate
for ABS, Pre-GED, GED, and AHS students. A sample of the competency goals
met by this activity can be found at the bottom of this
page.
Engage:
The The Bermuda Bouncing Balls Company is in the process of designing
a new toy -- a small robotic baseball player that will be able to catch
a ping pong ball after it bounces. In order to program the toy, they
need to know exactly how high the ball will bounce when it is dropped from
various heights. We have been hired to collect this data, and we
have been given the ping pong balls they will use for their first prototype
robots.
Explore:
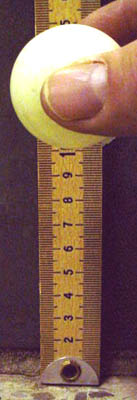
Each team is given a ping pong ball and a meter stick and asked to
begin to collect data. At first, students should be allowed to explore
freely, but the teacher may stop the group before they get too far to help
them come to consensus about what data they are going to take and how.
Are
we taking our drop height readings from the top of the ball or the bottom?
Does it matter? It makes the most sense to take the readings
from the bottom, as it is the bottom of the ball that hits the floor (so
the height of the bottom is the height the ball falls).
|
|
|
How should the bounce height be measured? Does it matter if the
viewer's eye is level with the bounce? Why or why not?
How can we minimize the effect of an misreadings? How many readings
should we take for each drop height? How many drop heights should
each group do? Does the surface onto which we drop the balls matter?
(The Bermuda Bouncing Balls Company has given us instructions that they
wish to have the balls bounced on the same material that is in the school's
hallway.) How should we organize our data in a table?
Note to the teacher: It is important that the students
work through the issues about consistent data collection by discussing
it with one another. However, you can facilitate this by asking good
questions. A reasonable set-up for this task involves them taking
three readings at every multiple of 10 cm drop height; later, they will
use the spreadsheet to average these results. It will be easiest
for them to put the data in a spreadsheet if they use a four column chart,
set up as follows:
| Drop Height (cm) | Average Bounce Height (cm) | Bounce 1 (cm) | Bounce 2 (cm) | Bounce 3 (cm) |
| 0 | ||||
| 10 | ||||
| 20 | ||||
| 30 | ||||
| 40 | ||||
| 50 | ||||
| 60 | ||||
| 70 | ||||
| 80 |
However, you need to evolve this chart as a class to give them a sense
of ownership. Be sure to get them to think this through. Why should
a drop height of 0 be considered? Why should we take an average
measurement? Does it matter if we work in centimeters or meters?
Explain Together:
This phase of the learning cycle involves the students making sense
from the data they collected. Let's start with the bounce itself. Why
does the ball bounce? Where did the energy come from that allows
the ball to bounce up from the floor? When a ball is lifted above
the ground, it gains the ability to fall under the influence of gravity
(the mutual attraction of the ball and the earth). We call this ability
to fall gravitational potential energy. We know that energy
is neither created or destroyed but just changes forms. So, where
did this gravitational potential energy come from? Ultimately,
we can trace this energy back to the sun, as the sun's energy was stored
as chemical potential energy in the bonds between the atoms of starch
molecules in corn; then, when a chicken ate some of this corn, it was stored
in the energy in the bonds between the atoms in the molecules in the egg
you ate for breakfast. Now, this energy can be released in your muscles
as you lift the ball up, with the energy still around as the gravitational
potential energy of the ball. When we drop the ball, the gravitational
potential energy of the ball is transformed into kinetic energy
(movement energy) on the way down. When the ball hits, this kinetic
energy is transferred into elastic potential energy as the ball
is momentarily "squished" out of shape, and then the ball springs
back and begins moving up, slowing down as it rises -- that is, as its
kinetic energy is transformed back into gravitational potential energy.
It should be clear from the data collected that the ping pong balls did not bounce as high as the height from which they were dropped. Why not? Though it is true that energy is not lost from a closed system, at each stage in the process outlined above, some of this energy is transferred to other forms. For instance, not all of the energy of the egg you ate went into the gravitational potential energy of the ball. Some was used to heat up your body, some to push the air out of the way as you lifted, etc. Since the ball has less gravitational potential energy at it highest point after it bounced than before you let it go, where did this energy go? Try closing your eyes, bouncing a ball and trying to tell when it hit. How can you tell? What caused the sound? What is sound? What leads you to believe that sound is a form of energy? Was energy 'lost' from the ball in any way other than the sound? Try swinging a piece of paper through the air flat and then on edge. Which was easier? Why? Where did the energy you expended go in each situation? As things move through the air, they experience friction with the molecules in the air and heat energy is produced.
Now that we understand the basic energy interactions involved in our exploration, let's look at some numbers. What would be a good way to get a sense of the basic trend that our data takes? Remember, the Bermuda Bouncing Ball Company wants us to be able to predict what height the ball will bounce given some drop height. What if the height they call for is not one of the ones we tested? The graph is a good way of visualizing a trend in data and using it to predict data points we have not collected. The first step is to put your data in a spreadsheet. (The following work was done in Microsoft Excel. For more details on working with this data in Excel, including how to use a formula to calculate the average bounce height, click here.)
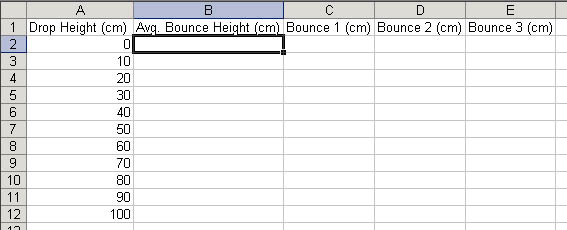
Note that the Average Bounce Height column (which will be calculated from the three pieces of data taken) is placed next to the Drop Height for ease of graphing later.
Before graphing, you have to ask, what sort of graph suits this data? Should this be a line graph or a bar graph? How can one determine this? A line graph is appropriate for continuos data, that is, data which makes sense at all values on the X axis. In this case, we can use a line graph since we could have take readings at any point. (For instance, we might have taken a reading when dropping the ball from 17.7 cm, though we didn't. Compare this to discontinuous data, such as the number of birds of each species at my feeder. Though there are such things as Robins or Chickadees, there are no Chobins or Rickadees. A line graph cannot be used for discontinuous data.)
If we select the appropriate data in the spreadsheet (Drop Height and Average Bounce Height) and choosing to do an X-Y scatter plot, we will be on our way. Before we go any further, we should ascertain whether we have stuck to the graphing conventions, with the independent variable (the one we manipulate) on the X axis, and the dependent variable (how the world responds) on the Y axis.
Does the data in our exploration suggest a trend? When
it does, we often use a line of best fit or "trend line" to show this trend.
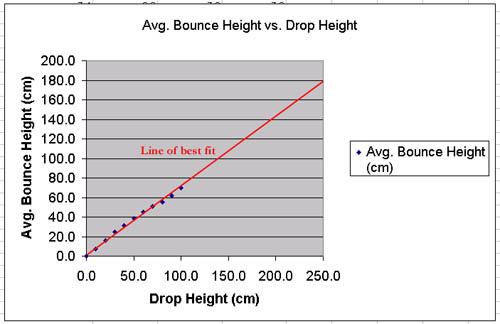
Of what use is the line of best fit? What does it allow us
to do? What sacrifices are we making? Why don't we just connect
the dots? A line of best fit allows us to get a sense of a trend
while ignoring small deviations that may not be significant; and with the
line of best fit, we can predict the results of experiments we haven't
performed yet. For instance, if the Bermuda Bouncing Ball Company
calls and wants data for a drop of 62 centimeters, we might interpolate
and report that the bounce is likely to be 46 cm. If they decided to make
a large version of their baseball robot and needed a prediction for a 250
cm drop, we could use the line of best fit and extrapolate to report
that the bounce is likely to be 180 cm. Interpolating (making
an educated guess between two data points) and extrapolating (making an
educated guess beyond your last data point) are both best guesses.
Which is likely to be more accurate? Why? Why would one ever
have to extrapolate?
Expand:
The phone rings and, wonder of wonders, it is the Bermuda Bouncing
Ball Company. They need three numbers, quickly. One is the
prediction for a 54 cm drop, and the others are the predictions for a 200
cm drop and a 250 cm drop. Each group should make their predictions
based on their graph and hand these predictions in. Then, each group
should go out and test each of these three drop heights (do three trials
for each) and compare these with their predictions.
In most cases, the bounce heights at 200 cm and 250 cm will be less than the predictions. Why? If there is a place where students could test a drop height that is greater than 250 cm (e.g. a stairwell), this should be tested as well; alternately, the teacher can have the data for a drop height that was done outside of class. Students can put in the data for these new drop points and make a new graph to see the trend:
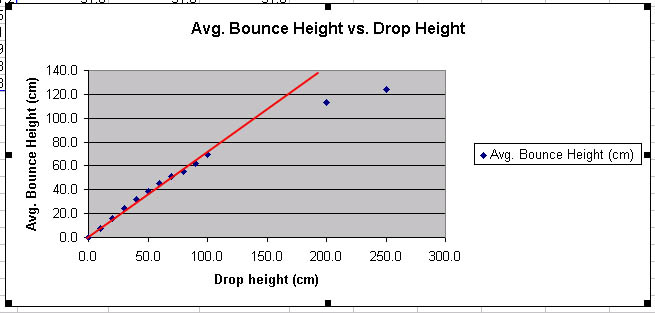
Looking at the graph, it becomes clear that the relationship between drop height and bounce height is linear only for small drop heights. As the drop height increases beyond a meter, the bounce height begins to level off, and at 3 meters drop height it is likely to be totally level. However, a ball dropped from 10 meters certainly starts with more gravitational potential energy than one dropped from 3 meters. How can it be that both bounce to the same height? Where did the extra energy go? Remember, the ball is expending some energy just pushing through the air -- that is, some of its potential energy is transferred to the air in the form of heat from friction. The faster the ball is going, the more air it goes through per second. At some point, the ball reaches its terminal velocity where all the gravitational potential energy is changed into heat and non is used to increase speed.
Evaluate:
The teacher should be doing formative evaluation all along,
asking questions, assessing data collection techniques, looking at graphing
strategies, assessing interpolation and extrapolation results, and evaluating
reasoning processes and inferences related to the phenomena studied.
By slowly introducing vocabulary and then using in throughout the lesson,
the teacher not only reinforces the ideas in the lesson, but also can get
a sense whether students have internalized the terms.
A summative evaluation for this lesson might include students writing a report to the Bermuda Bouncing Balls Company, summarizing the process by which they took data and sharing the data and graphs as well as their interpretations of the data. The teacher should look for:
Grade 5: Science
Competency Goal 2 The learner will build an understanding
of forms and sources of energy, especially
2.03 Analyze the interaction and transformation of the forms of energy.
Grade 6: Science
Competency Goal 4 The learner will investigate
the characteristics of energy transfer, especially:
4.04 Evaluate data for qualitative and quantitative relationships associated
with energy transfer and/or transformation.
4.06 Examine the law of conservation of energy.
Grade 8: Science
Competency Goal 4 The learner will build an understanding
of motion and forces, especially:
4.01 Analyze gravity as a universal force.
4.06 Describe and measure quantities that characterize moving objects
and their interactions within a system.
Secondary: Physical Science
Competency Goal 1 The learner will construct an understanding
of mechanics.
Secondary: Physics
Competency Goal 5 The learner will develop an understanding
of the nature of mechanical energy.
All Grades: Technology/Computer Skills
Competency Goal 2 The learner will demonstrate knowledge and skills
in the use of computer and other technologies.
Competency Goal 3 The learner will use a variety of technologies
to access, analyze, interpret, synthesize, apply, and communicate information.
©2004 Jeff Goodman