Isotopes are fully supported by SPECTRUM in the ``isotope mode'', which
can be invoked with the ``i'' switch (see § ![[*]](crossref.png) ). It
must be understood that SPECTRUM does not automatically calculate
isotope shifts; the isotopic components of a given spectral line must
be included in the spectral linelist as individual entries. The
format of an isotopic spectral linelist is different from the format
for the standard linelist; it must include an additional column
indicating the mass number or ``isotope code'' of the isotope in
question. As an example, consider the following entries used for the
computation of the Li I 6708Å resonance line:
). It
must be understood that SPECTRUM does not automatically calculate
isotope shifts; the isotopic components of a given spectral line must
be included in the spectral linelist as individual entries. The
format of an isotopic spectral linelist is different from the format
for the standard linelist; it must include an additional column
indicating the mass number or ``isotope code'' of the isotope in
question. As an example, consider the following entries used for the
computation of the Li I 6708Å resonance line:
6703.568   26.0  0  22249   37163   -3.15   1.000 01  NIST
6704.476   26.0  0  34017   48928   -2.659  1.000 10  NIST
6705.106   26.0  0  37186   52090   -1.17   1.000 99  AGL
6707.44    26.0  0  37186   52090   -2.40   1.000 99  AGL
6707.752   21.0  0  32659   47563   -2.672  1.000 99  K23
6707.754    3.0  7      0   14904   -0.431  1.000 01  AGL
6707.766    3.0  7      0   14904   -0.209  1.000 01  AGL
6707.771   20.0  0  46748   61652   -4.015  1.000 99  K23
6707.824   26.1  0  93488  108392   -3.094  1.000 99  K23
6707.904    3.0  7      0   14904   -0.733  1.000 01  AGL
6707.917    3.0  7      0   14904   -0.510  1.000 01  AGL
6707.921    3.0  6      0   14904   -0.005  1.000 01  AGL
6708.053   26.1  0  93485  108388   -3.614  1.000 99  K23
6708.072    3.0  6      0   14904   -0.306  1.000 01  AGL
6708.094   23.0  0   9825   24728   -3.113  1.000 99  KFE
6708.167   26.1  0  89727  104630   -3.979  1.000 99  K23
6710.316   26.0  0  11976   26875   -4.874  1.000 21  NIST
6712.44    26.0  0  40231   55125   -2.149  1.000 99  NIST
6713.77    26.0  0  38678   53569   -1.602  1.000 12  NIST
Compare the format of this linelist with that illustrated in
§ . The third column contains the mass number of
the isotope involved; for instance, the entry for the spectral line
with a wavelength of 6707.754Å in the above list is for the isotope
![]() Li, and the one for 6707.921Å is for
Li, and the one for 6707.921Å is for ![]() Li. Note that many of
the spectral lines in the above example have isotope codes of ``0''.
The ``0'' code corresponds to the case in which the isotope shifts
are considered to be zero, and thus these entries represent all
possible isotopes for that species taken together. So, for instance,
since iron (26) has isotopes with mass numbers 54, 56, 57, and 58, the
single entry
Li. Note that many of
the spectral lines in the above example have isotope codes of ``0''.
The ``0'' code corresponds to the case in which the isotope shifts
are considered to be zero, and thus these entries represent all
possible isotopes for that species taken together. So, for instance,
since iron (26) has isotopes with mass numbers 54, 56, 57, and 58, the
single entry
6703.568 26.0 0 22249 37163 -3.15 1.000 01 NISTis equivalent to the entries
6703.568   26.0 54  22249   37163   -3.15   1.000 01  NIST
6703.568   26.0 56  22249   37163   -3.15   1.000 01  NIST
6703.568   26.0 57  22249   37163   -3.15   1.000 01  NIST
6703.568   26.0 58  22249   37163   -3.15   1.000 01  NIST
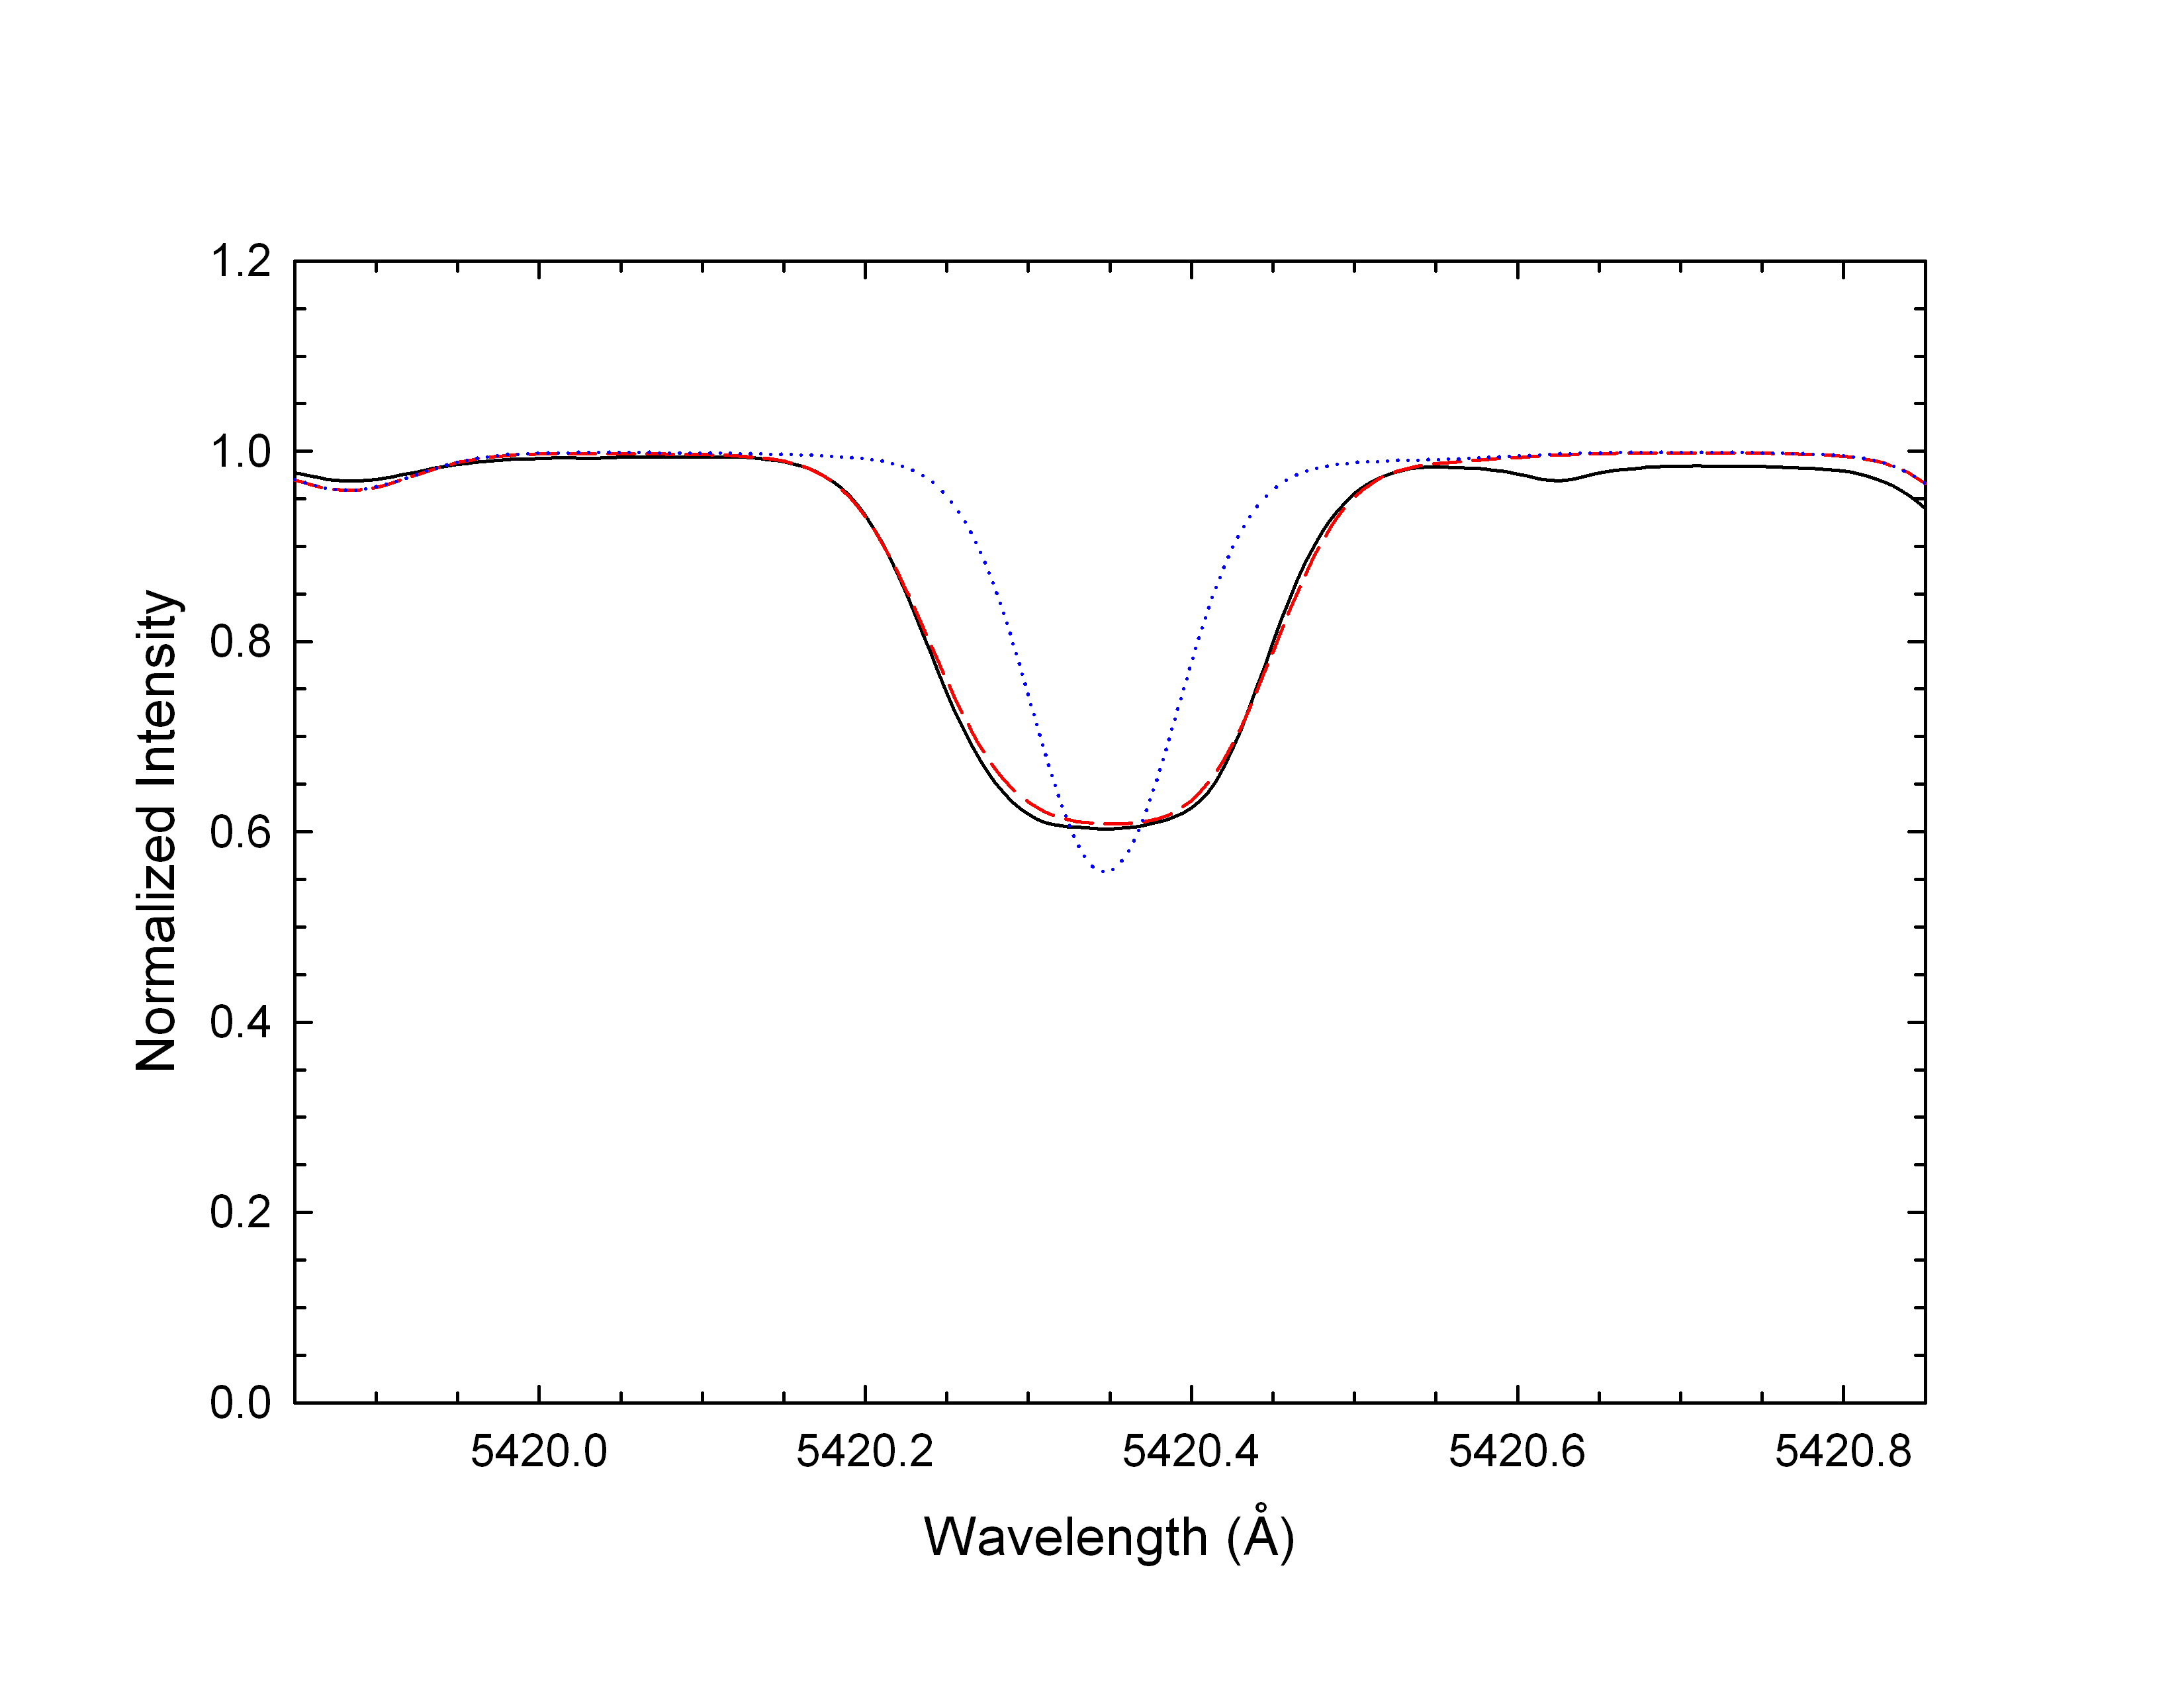 |
Isotopes with odd nucleon numbers can exhibit hyperfine
structure; elements with odd atomic numbers are especially subject to
this phenomenon. Thus, lines of vanadium (23), manganese (25), cobalt
(27) and copper (29) in the solar spectrum commonly show unusually
broad profiles formed from the superposition of a number of hyperfine
components (see Figure ). It is quite a frequent
occurrence for a single line to
show both isotope shifts and hyperfine structure; the Ba II 4554Å resonance line is a case in point, and so is the important Eu II
4129.7Å resonance line, the components of which are listed below:
4129.628  -63.1   151      1   24208   -1.512  1.000 01  LWDS
4129.631  -63.1   151      1   24208   -1.035  1.000 01  LWDS
4129.645  -63.1   151      1   24208   -1.316  1.000 01  LWDS
4129.649  -63.1   151      1   24208   -0.977  1.000 01  LWDS
4129.653  -63.1   151      1   24208   -1.512  1.000 01  LWDS
4129.670  -63.1   151      0   24208   -1.257  1.000 01  LWDS
4129.675  -63.1   151      0   24208   -0.847  1.000 01  LWDS
4129.680  -63.1   151      0   24208   -1.316  1.000 01  LWDS
4129.703  -63.1   151      0   24208   -1.294  1.000 01  LWDS
4129.708  -63.1   153      0   24208   -1.512  1.000 01  LWDS
4129.709  -63.1   151      0   24208   -0.696  1.000 01  LWDS
4129.711  -63.1   153      0   24208   -1.035  1.000 01  LWDS
4129.715  -63.1   151      0   24208   -1.257  1.000 01  LWDS
4129.715  -63.1   153      0   24208   -1.316  1.000 01  LWDS
4129.718  -63.1   153      0   24208   -0.977  1.000 01  LWDS
4129.721  -63.1   153      0   24208   -1.512  1.000 01  LWDS
4129.725  -63.1   153      0   24208   -1.257  1.000 01  LWDS
4129.728  -63.1   153      0   24208   -0.847  1.000 01  LWDS
4129.732  -63.1   153      0   24208   -1.316  1.000 01  LWDS
4129.740  -63.1   153      0   24208   -1.294  1.000 01  LWDS
4129.743  -63.1   153      0   24208   -0.696  1.000 01  LWDS
4129.744  -63.1   151      0   24208   -1.480  1.000 01  LWDS
4129.746  -63.1   153      0   24208   -1.257  1.000 01  LWDS
4129.751  -63.1   151      0   24208   -0.545  1.000 01  LWDS
4129.757  -63.1   151      0   24208   -1.294  1.000 01  LWDS
4129.760  -63.1   153      0   24208   -1.480  1.000 01  LWDS
4129.761  -63.1   153      0   24208   -0.545  1.000 01  LWDS
4129.764  -63.1   153      0   24208   -1.294  1.000 01  LWDS
4129.786  -63.1   153      0   24208   -0.401  1.000 01  LWDS
4129.787  -63.1   153      0   24208   -1.480  1.000 01  LWDS
4129.801  -63.1   151      1   24208   -0.401  1.000 01  LWDS
4129.808  -63.1   151      1   24208   -1.480  1.000 01  LWDS
Obviously, in this example, SPECTRUM must be used in the isotope mode,
as the Eu II 4129.7Å line involves not only hyperfine components
but also isotopic components (indicated by the isotope numbers 151 and 153).
Note in this example that the species code (63.1 for Eu II) is entered
as a negative number. This prompts SPECTRUM to increase the computation
radius for such spectral lines by a factor of three. This is done
because each hyperfine component taken on its own may be a very weak
spectral line (and thus would have a small computation radius assigned
to it), but since it overlaps with other closely spaced
hyperfine components, if its computation radius were not increased
the far wings of the combined spectral line could be truncated.
Indeed, this trick can be used if you observe SPECTRUM truncating the
far wings of any line; enter the species code for that line as a
negative number, and the normal computation radius for that line will
be tripled, up to a maximum of 20Å (10Å in the optical). A handful of
lines, such as the Ca II K and H lines, obviously need a larger computational
radius than this, and such lines are actually hard-coded into SPECTRUM.
See § for more details.