
Realtime Data From Boone Creek, Boone NC
Department of Geology: Appalachian State University
Boone Creek is an urban headwater stream that flows through the ASU Campus and downtown Boone. The Department of Geology has been monitoring stream discharge and water quality parameters (e.g., stream temperature and electrical conductivity) in Boone Creek since 2006, when two stream gauges were installed, one at Jimmy Smith Park and one at the Central Dining Hall. Our current monitoring setup includes 28 temperature dataloggers, seven electrical conductivity sensors, two stilling-well stream gauges, and four in-stream stage gauges. These data have been downloaded and managed by undergraduate geology majors since the network was established.
The realtime data accessible here are from the stream gauge at Varsity Gym. Our automated datalogger installed in a stilling well at the site measures pressure, water level, and temperature every 15 minutes. The data are then uploaded to our web server every hour, and the data are processed by an automated perl script written by Dr. Scott T. Marshall and visualized using Generic Mapping Tools. Here, we provide realtime visualization of these data along with access to the source data. Stream discharge data derive from a rating curve developed by Emily Fedders, a student in the Department of Geology, with assistance from Dr. Bill Anderson. Individual stream discharge measurements contributing data to the rating curve development have been made by a number of undergraduate geology majors including Claire Harris, Jake Schenk, and Cole Thompson among others.
For questions about Boone Creek monitoring activities, Boone Creek hydrology, the data available at this website, peer-reviewed publications stemming from these data, or other hydrologic questions, please contact Dr. Bill Anderson, Professor and Chair of the Department of Geology. For information about the geochemistry of Boone Creek, please contact Dr. Chuanhui Gu, Associate Professor in the the Department of Geology.
Disclaimer: The data presented here are preliminary and have not been subject to quality control.All Time Series Data (n=14684): CSV: 1.1MB
Right-Click on the link above and select "Save Link As" to save the file to your computer.
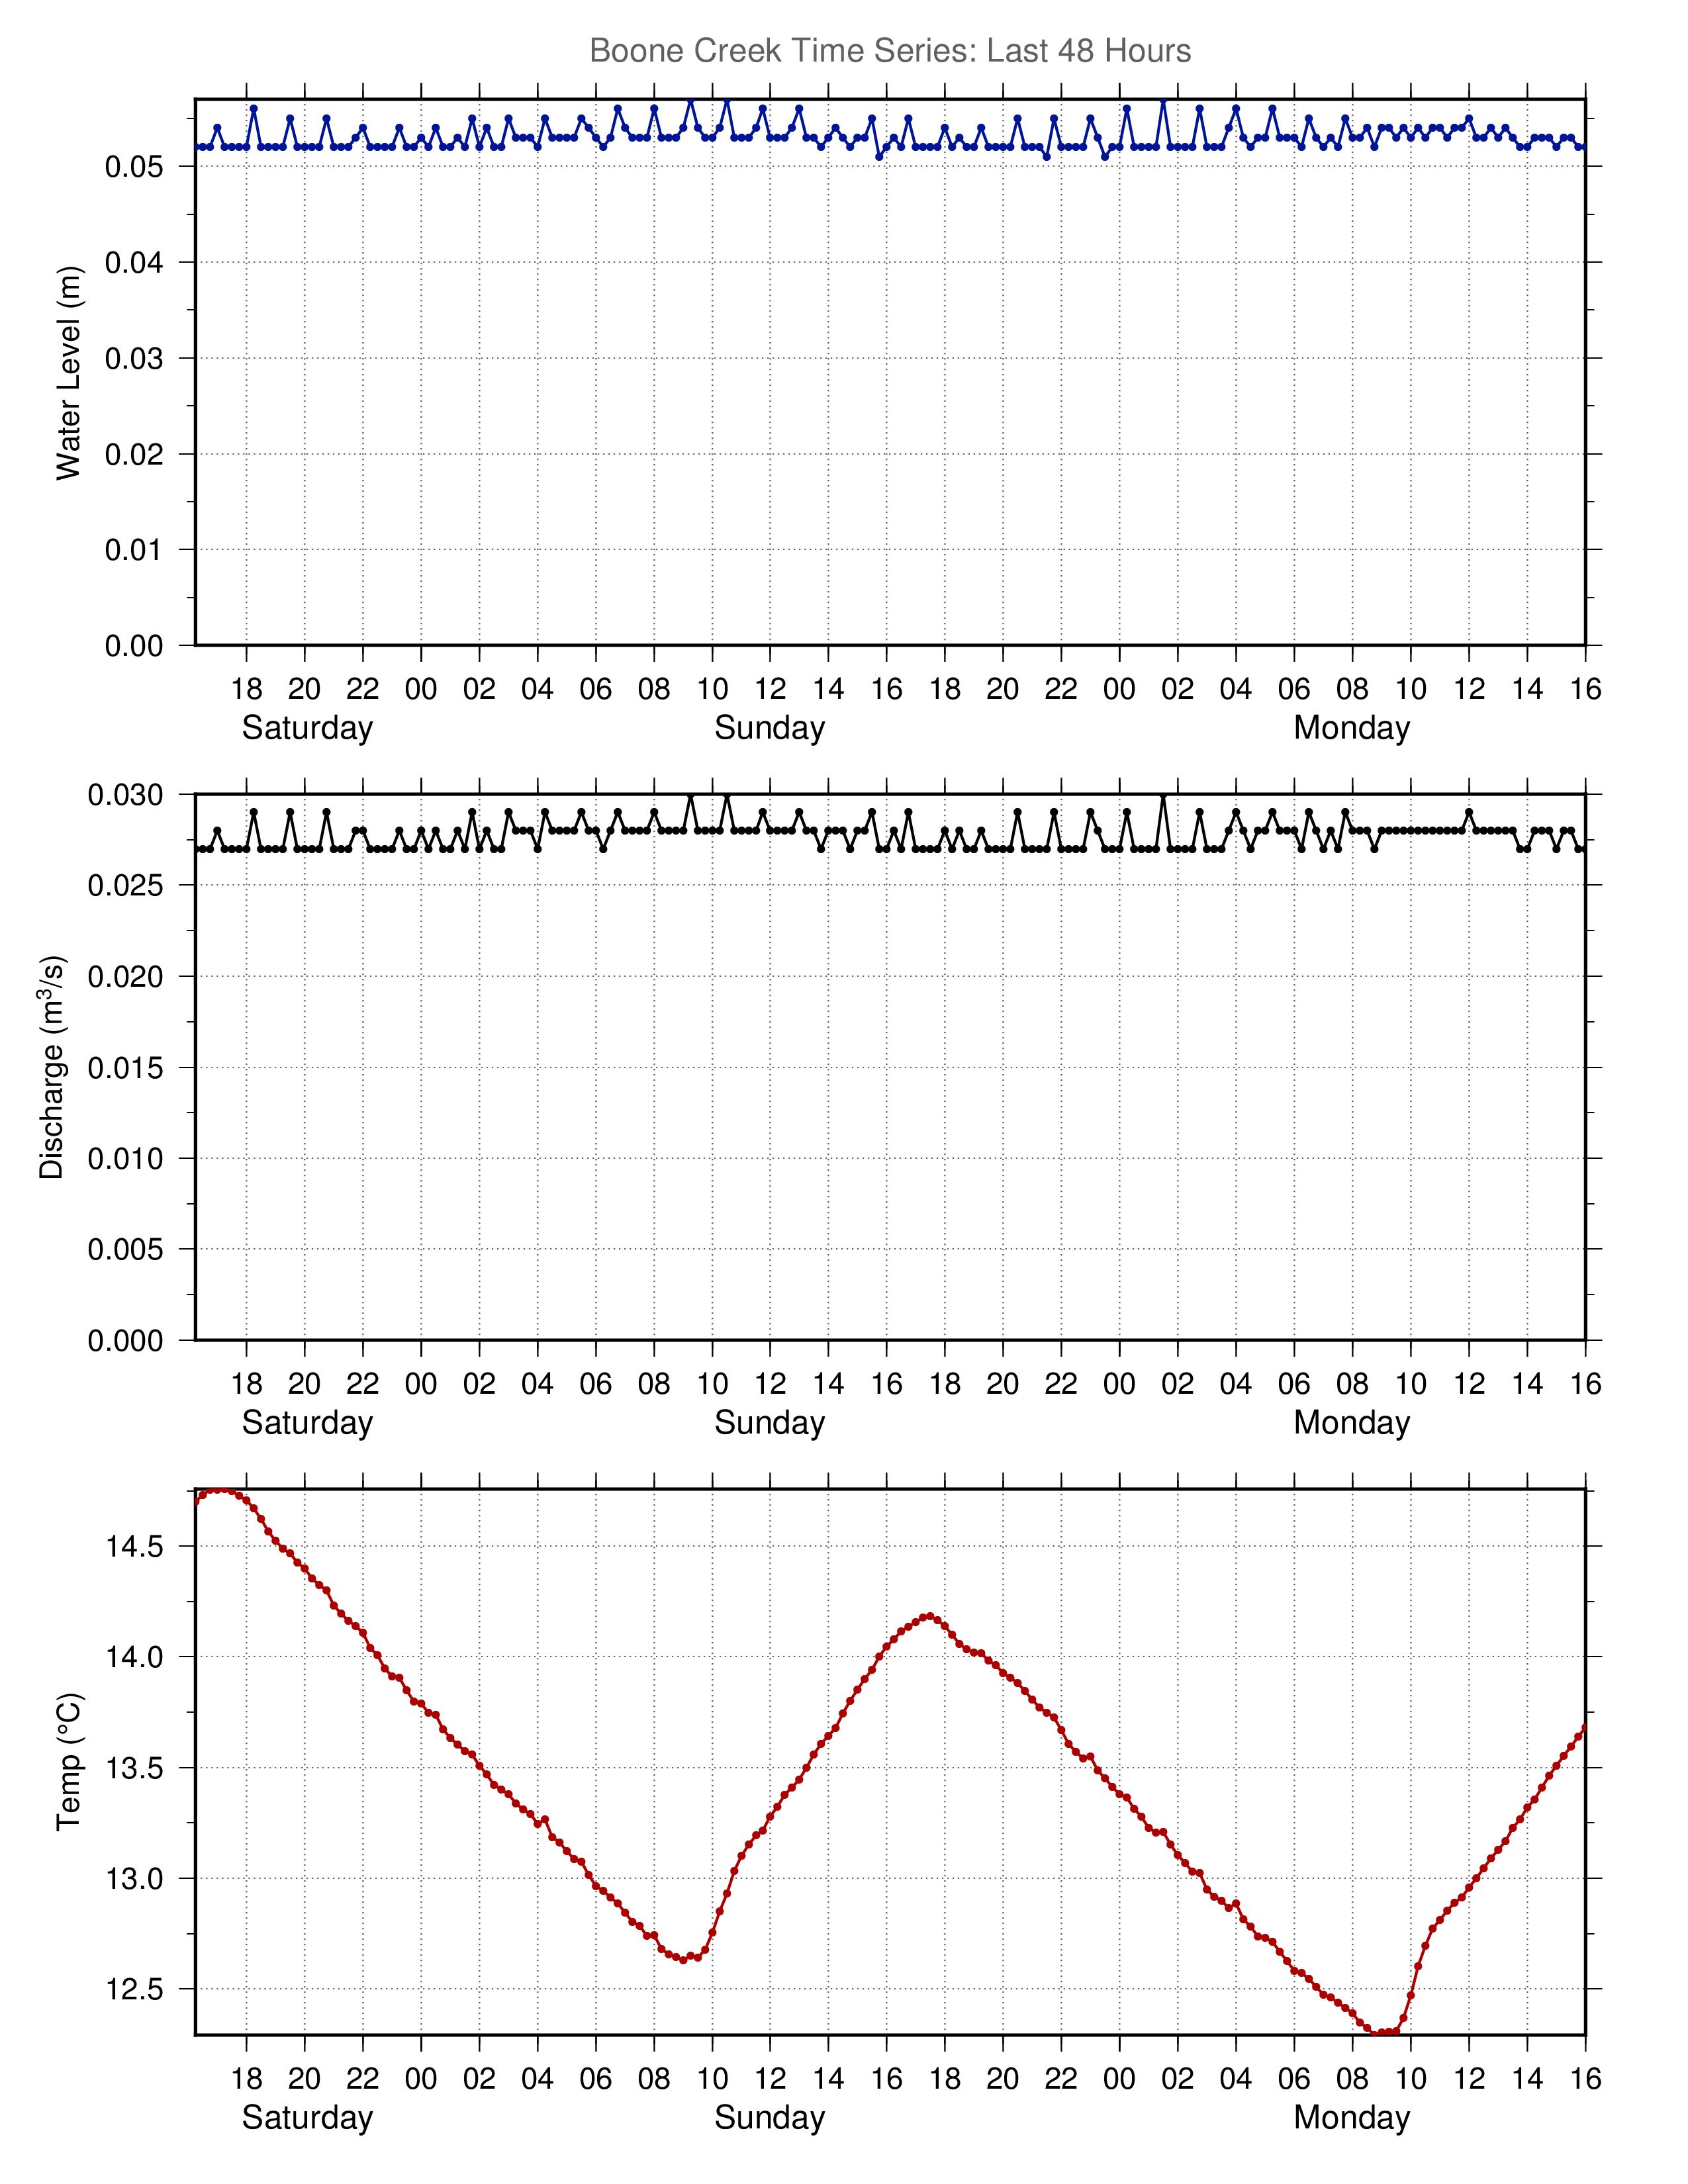
Boone Creek Time Series: Last 48 Hours
Updated 2017-02-06 09:05
Download plots: PNG 244KB : PDF 48KB : EPS 96KB