
Mechanics, Slip Behavior, and Seismic Potential of Corrugated Dip Slip Faults
Anna Morris || 2009-2010
To better understand the mechanics and seismic potential of non-planar fault surfaces, created a suite of numerical models of faults with sinusoidal corrugations in the down-dip direction. We introduce systematic variations in corrugation wavelength, amplitude, and loading angle to determine the effects of corrugations on slip behavior and seismic moment release. In general, corrugated faults slip less than planar faults, and have smaller scalar seismic moment releases, and often have rather complex slip distrubutions. The results of this work were published in the Journal of Geophysical Research in March of 2012. See the figures below for some of our results.
Examples of Corrugated Faults in Southern California
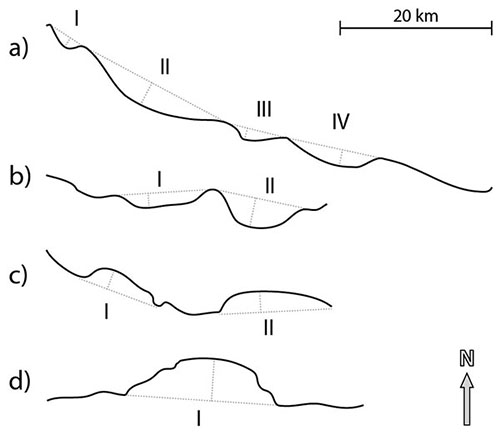
Above: Examples of several well-constrained, km-scale, wavy fault trace geometries of reverse faults based on the Southern California Earthquake Center (SCEC) Community Fault Model (CFM). The faults shown are a) Sierra Madre, b) San Cayetano, c) Santa Susana, and d) Pleito. All fault traces are shown in map view.
Modeled Fault Geometry
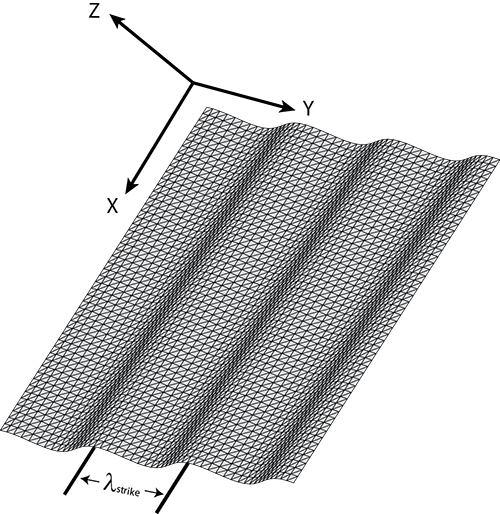
Above: Corrugated fault surfaces here are defined using a sinusoidal function of the y-coordinate. A single wavelength is defined along the direction of strike. This produces a corrugated fault surface similar to but in simplified form (i.e. no small scale roughness) of many exhumed natural fault surfaces.
Loading Directions Tested
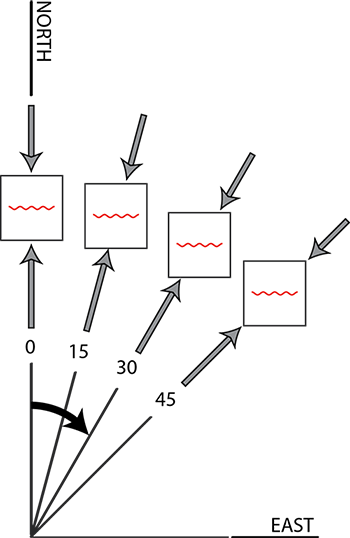
Above: Schematic sketch showing the various tested loading angles measured clockwise relative to north. The upper tip of the modeled fault is shown by a red wavy line. All modeled faults strike west and dip to the north at 45°
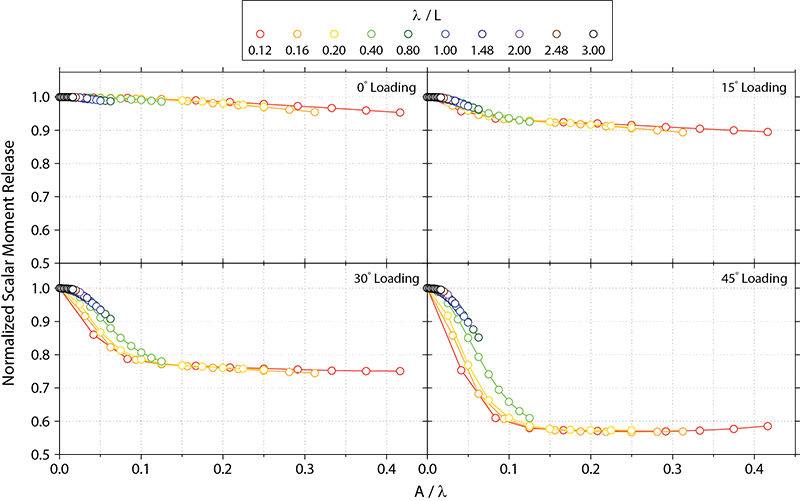
Average Net Slip Behavior
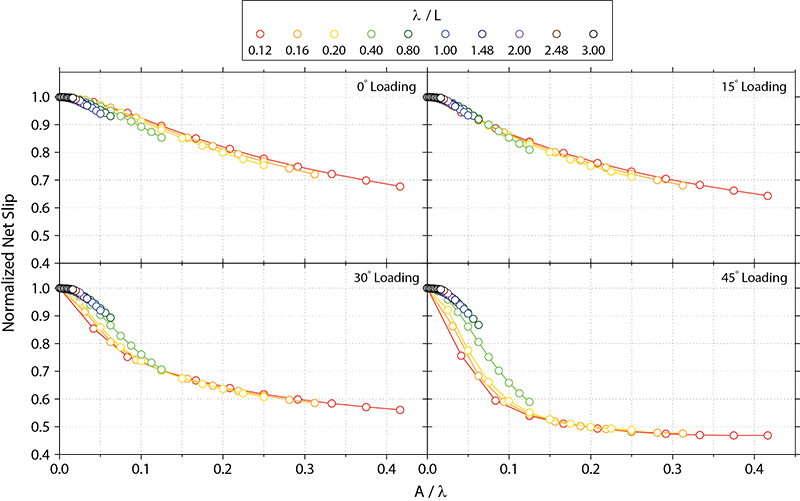
Above: Effects of corrugation amplitude/wavelength ratio on average net slip for four different loading angles tested. Note that in all subsequent figures, λ is wavelength of corrugation, L is the fault length (which is constant), and A is the amplitude. All slip/seismic moment values are normalized by the reference planar model, so any value < 1 means a decrease, and > means and increase compared to a planar fault. The consistent behavior of all models suggests that the key geometrical parameter controlling the net slip potential of a fault surface is the amplitude/wavelength ratio.
3D Slip Distributions (0° Loading)
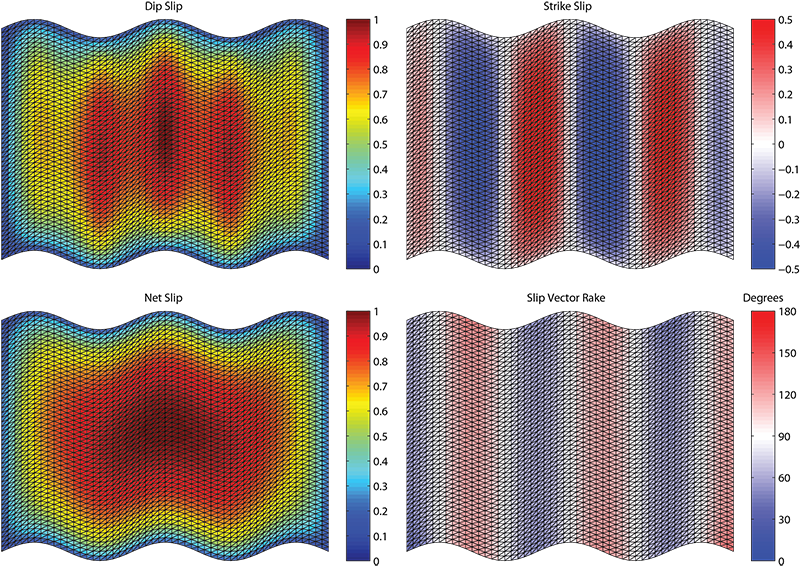
Above: Slip maps showing the spatial distribution of slip on a modeled fault loaded at 0° with a normalized wavelength of 0.4 and amplitude of 0.04 (i.e. A/λ = 0.1). The plots are viewed in map view using an orthographic projection to prevent geometric distortion of the fault shape due to perspective view. The upper tip lines are at the bottom of each fault surface (i.e. the faults all dip to the north). All slip shown here is normalized by the maximum net slip on a planar fault that is loaded at the same angle as the surfaces shown here. While the bulls-eye pattern of net slip magnitude is strikingly similar to planar fault (in an infinite elastic wholespace), the dip slip and strike-slip distributions are more complex. For example, opposing limbs in each corrugation slip with opposite senses of slip and accumulate mostly strike-slip that is up to ~50% of the planar net slip. This results in opposing limbs of a corrugation having a marked change in slip vector rake. Because the lateral slips are nearly equal and opposite, the average net slip vector is approximately 90°, suggesting pure dip slip on average.
3D Slip Distributions (45° Loading)
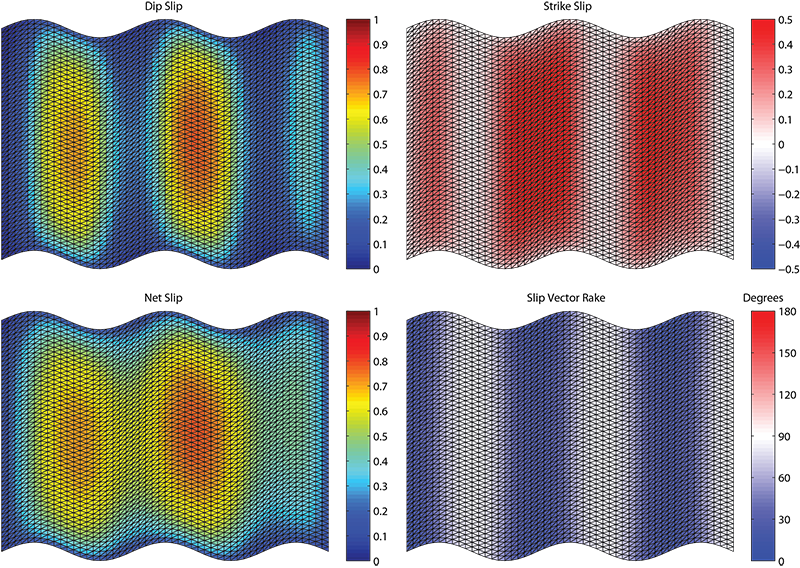
Above: Slip maps for the same fault shown in the previous image but loaded at 45°. When loading angle is increased, dip slip becomes localized along corrugation limbs where the fault surface strikes nearly orthogonal to the loading direction. Opposing limbs accumulate only minor amounts of dip slip due to their orientation relative to the principal stress direction. Conversely, strike-slip is at a minimum in corrugation limbs where the dip slip is a maximum, while the opposing limb accumulates a significant amount of strike-slip. This results in one limb accumulating dominantly dip slip (the nearly white portions of the rake plot) and the opposing limb being dominantly left-lateral strike-slip. The combined effects produce a net slip distribution where net slip is maximized in regions that are optimally oriented for dip-slip.
3D Slip Vectors on Corrugated Faults
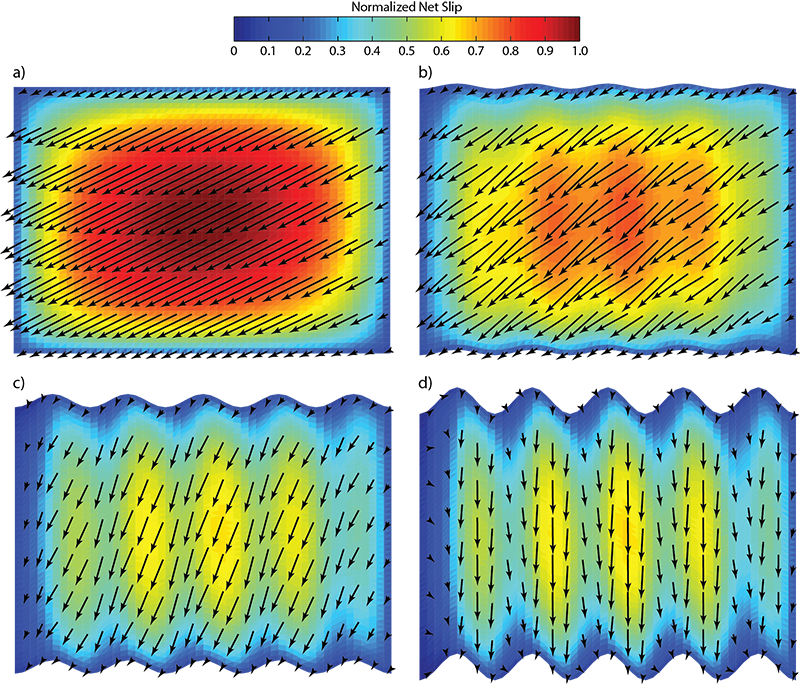
Above: Net slip vector maps (same view and normalization as in previous figures) of an increasingly
corrugated non-planar fault with a normalized wavelength of 0.2 and loaded at 45°. The colored fault surface
shows the magnitude of normalized net slip while the vectors show the direction and relative magnitude of net slip.
The slip vectors represent the sum of displacements on both the hanging walls and footwalls of the faults and are
mapped as hanging wall motions.
A) Slip on a planar fault surface showing oblique slip. Note that on a planar fault surface there are no
predicted variations in slip vector rake (see images above).
B) Slip on a fault surface with an amplitude/wavelength ratio of 0.05.
C) Slip on a fault surface with an amplitude/wavelength ratio of 0.125.
D) Slip on a fault surface with an amplitude/wavelength ratio of 0.25.
Note that as amplitude/wavelength increases, the slip vectors become parallel to the corrugations regardless of
the driving stress orientation. This suggests that paleostress inversions may be unreliable.
Scalar Seismic Moment Release
Above: Plots of total scalar seismic moment release for the four principal stress directions tested. In all cases tested, the total scalar moment release for corrugated faults is less than the reference planar fault. Therefore, all other factors equal, a corrugated fault will have less seismic potential than a planar fault.