 Click
on the thumbnail
Click
on the thumbnailRegression Analysis in Excel
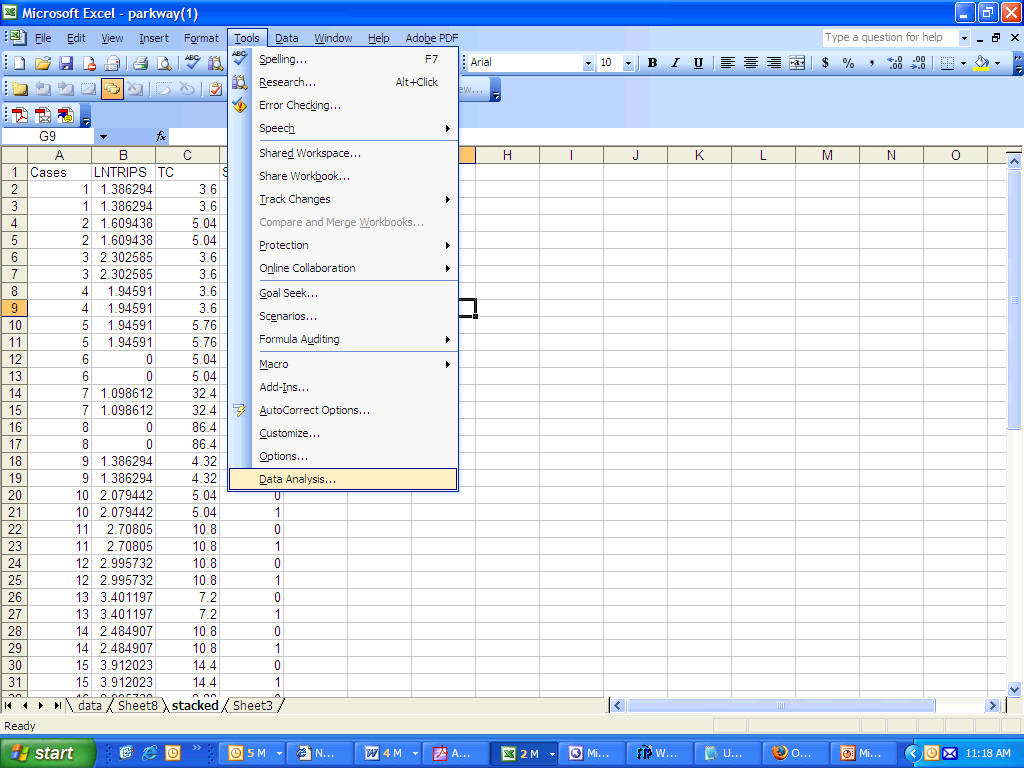
1. Click on Tools => Data Analysis (OK)
Click
on the thumbnail
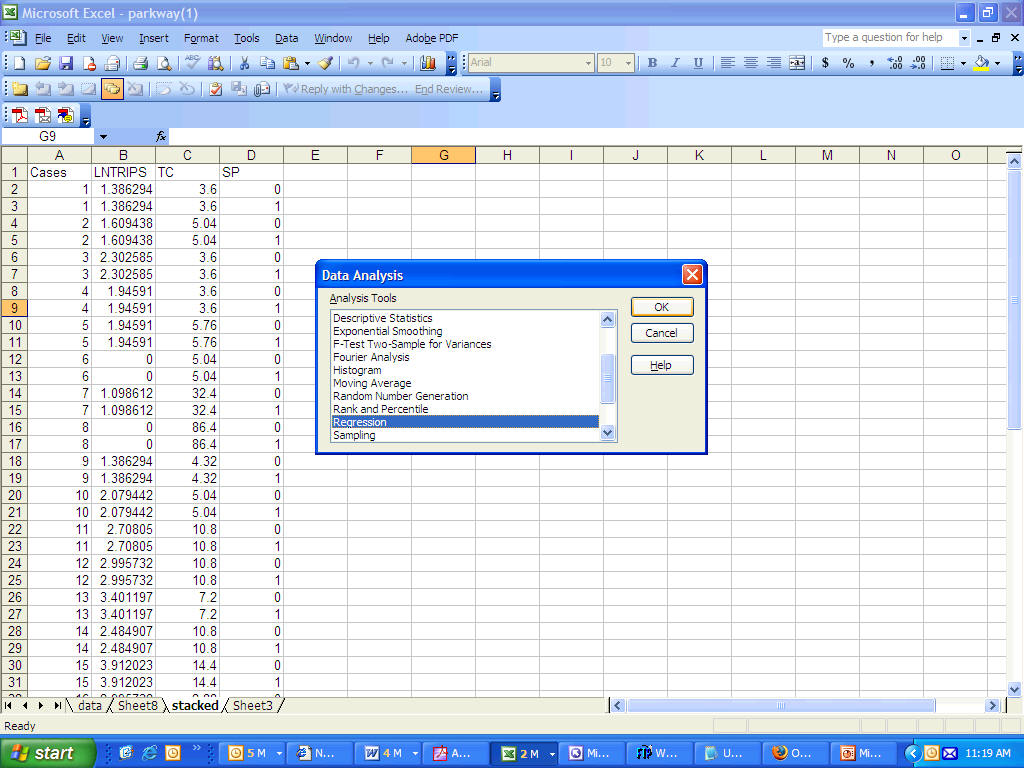
2. Highlight Regression (OK)
 Click
on the thumbnail
Click
on the thumbnail
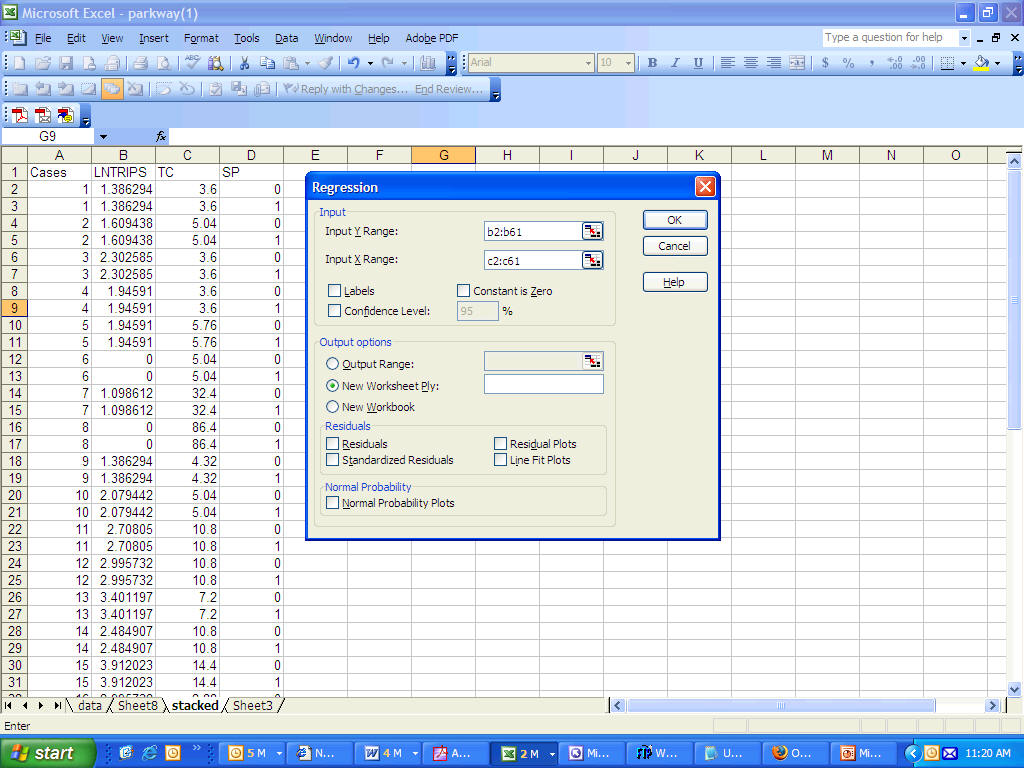
3. Dependent variable: Input Y Range. Independent variable: Input X Range (OK) (multiple regression can be handled with consecutive columns of data)
 Click
on the thumbnail
Click
on the thumbnail
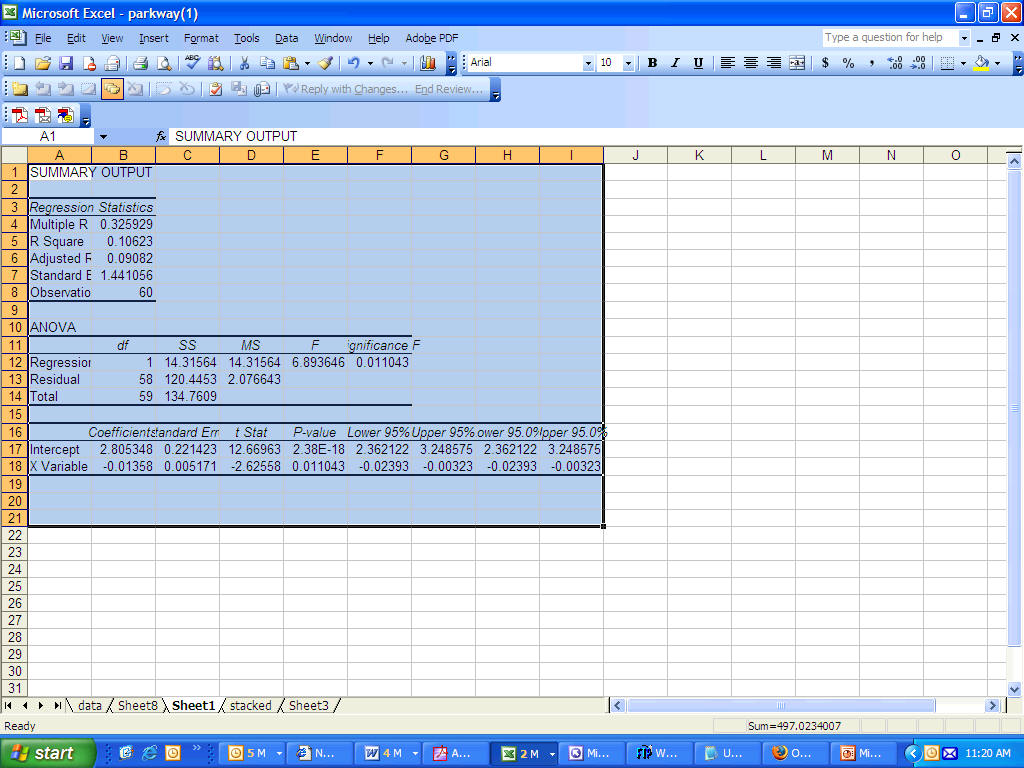
4. Output
 Click
on the thumbnail
Click
on the thumbnail
5. Graph
Travel Cost
 ln(Trips)