Autoionizing lines arise from doubly excited states in which the upper level
of the transition is above the ionization energy. Autoionizing lines
are characterized by a Fano profile instead of a Voigt profile. Fano
profiles depend on three parameters:
![]() ,
,
![]() , and
, and ![]() , where
, where
![]() is the
profile half width,
is the
profile half width, ![]() is the asymmetry parameter, and
is the asymmetry parameter, and
![]() is related to the oscillator strength. More information on these parameters
may be found in Shore (1967) and Shore (1968). Most autoionizing lines
are in the ultraviolet, but there are a few such lines that appear in the
optical. Perhaps the best known of these are the Ca I autoionizing lines
in the orange (see below). Beginning with version 2.76, the Fano parameters
may be entered into the line list in a way similar to entering the radiation,
Stark and van der Waals half widths described in the previous subsection.
For instance, for the autoionizing Ca I line at 6343.308Å, enter:
is related to the oscillator strength. More information on these parameters
may be found in Shore (1967) and Shore (1968). Most autoionizing lines
are in the ultraviolet, but there are a few such lines that appear in the
optical. Perhaps the best known of these are the Ca I autoionizing lines
in the orange (see below). Beginning with version 2.76, the Fano parameters
may be entered into the line list in a way similar to entering the radiation,
Stark and van der Waals half widths described in the previous subsection.
For instance, for the autoionizing Ca I line at 6343.308Å, enter:
6343.308 20.0 0 35819 51579 0.845 1.000 AI 11.28 -30.00 -13.38 AUTO
where
![]() ,
,
![]() , and
, and
![]() . Note, however, if the asymmetry parameter
. Note, however, if the asymmetry parameter
![]() , the entry should be -
, the entry should be -
![]() , which will
be a positive quantity. The
Fano parameters may be computed from first principles using the references
cited above, by fitting resonances in photoionization cross sections (such as
those from the Opacity
Project3.2),
or they may be derived from the Kurucz line lists or other sources.
Note the AI transition type. Autoionizing
lines are often extraordinarily broad. Figure
, which will
be a positive quantity. The
Fano parameters may be computed from first principles using the references
cited above, by fitting resonances in photoionization cross sections (such as
those from the Opacity
Project3.2),
or they may be derived from the Kurucz line lists or other sources.
Note the AI transition type. Autoionizing
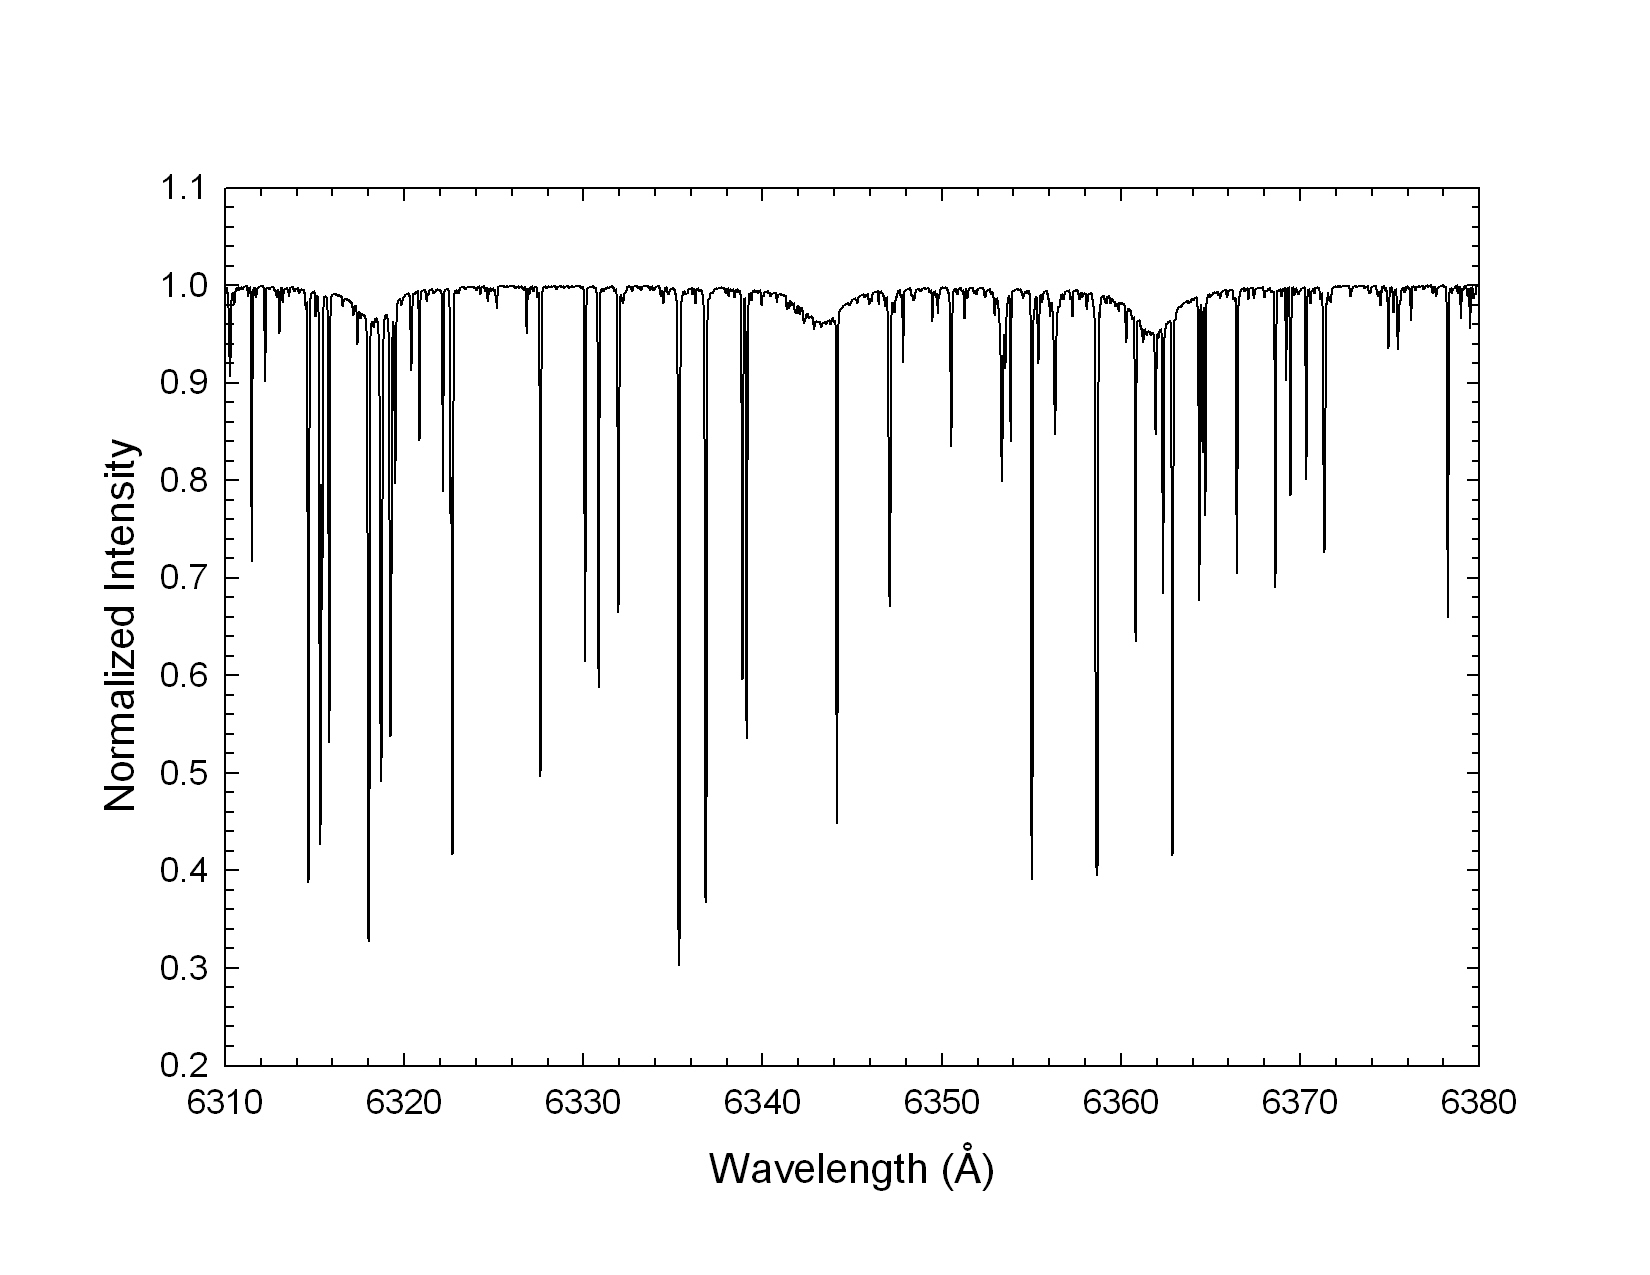
lines are often extraordinarily broad. Figure ![[*]](crossref.png) shows a
synthesis of the region around the three orange Ca I autoionizing lines.
shows a
synthesis of the region around the three orange Ca I autoionizing lines.
 |