 |
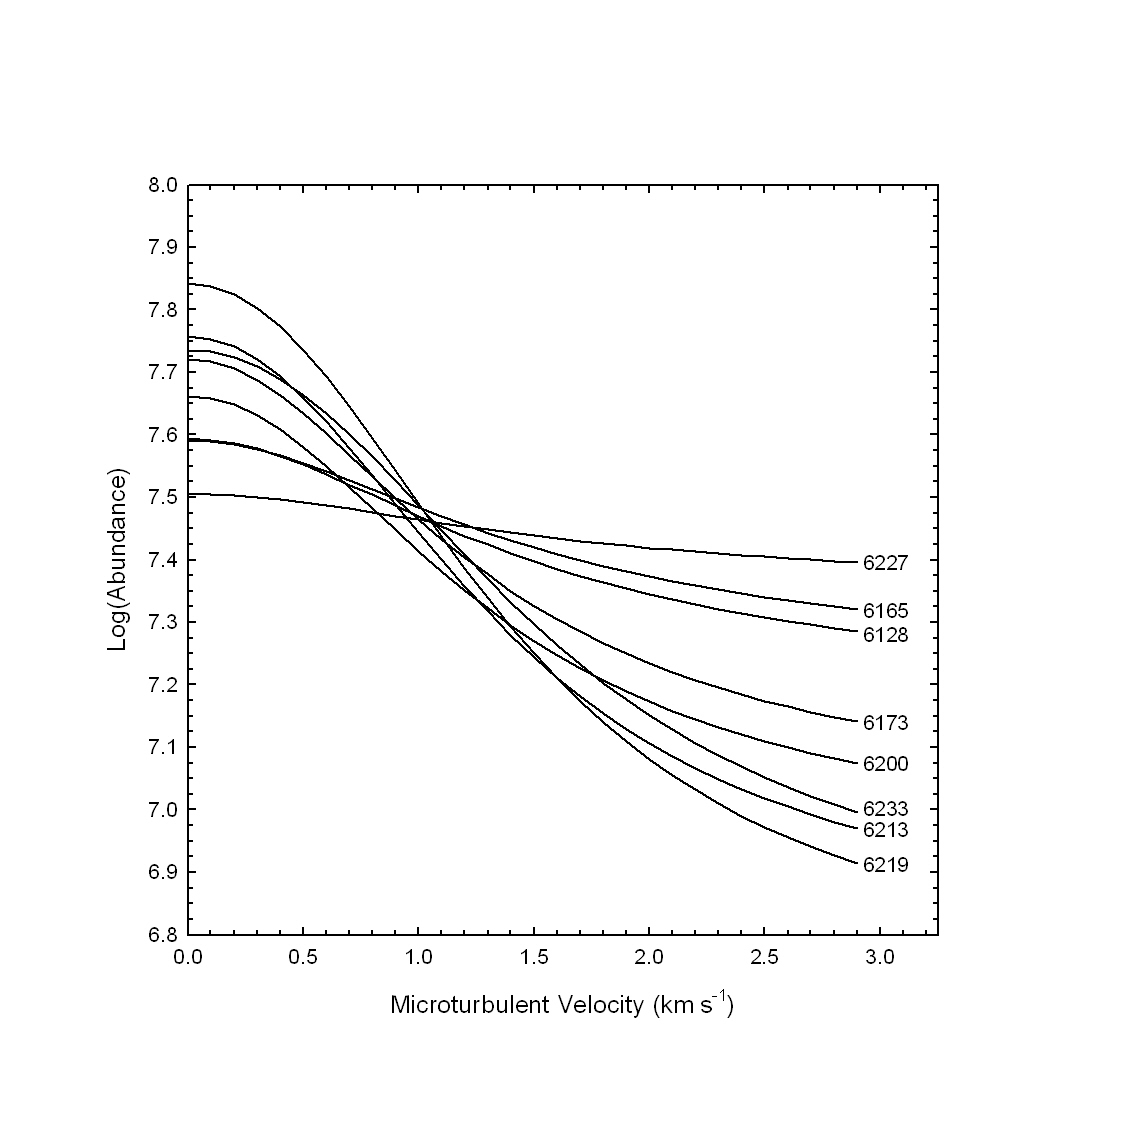
BLACKWEL computes the data required for the plotting of a ``Blackwell
diagram" (see Blackwell & Shallis, 1979) for a set of spectral lines of
a given species with measured equivalent widths. Blackwell
diagrams are used to determine the abundance of an element simultaneously with
the microturbulent velocity for a star. That is to say, Blackwell
diagrams give the same information as
the classical curve of growth method, but without the debilitating
effects of the many invalid assumptions inherent to that method. A Blackwell
diagram is a plot of the abundance versus the microturbulent
velocity (see Figure ![[*]](crossref.png) ); for each line in the set, the
abundance required
to yield the measured equivalent width is computed as a function of the
microturbulent velocity. Each spectral line is thus represented as a curve in
the diagram; for weak lines on the linear part of the curve of growth, the
curve is nearly horizontal, for stronger lines, the curves slope more
steeply. Ideally, all of these curves should intersect at a single point
which would then give the elemental abundance and microturbulent velocity
simultaneously. In practice, there is a region of ``least confusion'',
from which the elemental abundance, the microturbulent velocity and the
associated errors may be estimated. The microturbulent velocity so
determined should be the same, within the errors, for all species.
So, a practical way to proceed would be to construct a Blackwell diagram
for a species well represented by a large number of measurable lines
(say, Fe I), and the resulting microturbulent velocity considered as
a fixed quantity in the calculation of other elemental abundances
using a program such as ABUNDANCE.
); for each line in the set, the
abundance required
to yield the measured equivalent width is computed as a function of the
microturbulent velocity. Each spectral line is thus represented as a curve in
the diagram; for weak lines on the linear part of the curve of growth, the
curve is nearly horizontal, for stronger lines, the curves slope more
steeply. Ideally, all of these curves should intersect at a single point
which would then give the elemental abundance and microturbulent velocity
simultaneously. In practice, there is a region of ``least confusion'',
from which the elemental abundance, the microturbulent velocity and the
associated errors may be estimated. The microturbulent velocity so
determined should be the same, within the errors, for all species.
So, a practical way to proceed would be to construct a Blackwell diagram
for a species well represented by a large number of measurable lines
(say, Fe I), and the resulting microturbulent velocity considered as
a fixed quantity in the calculation of other elemental abundances
using a program such as ABUNDANCE.
The set of spectral lines used to construct the Blackwell diagram should be placed in a file in which each line has the following format (identical to the format used for ABUNDANCE and GFADJUST):
6165.361 26.0 33413 49628 -1.45 1.000 21 37.4 NISTHere the wavelength, code, E(lower), E(higher), log(gf), the damping factor, and the transition type are in exactly the same format as in luke.lst. The equivalent width (the second to last entry), derived from a measurement in a stellar spectrum, is expressed in milli-angstroms (mÅ). All of the broadening codes used in SPECTRUM are also valid in BLACKWEL. An example file feI.eqw is provided in the distribution. It can be used in conjunction with the model 67244k2p00.mod to test BLACKWEL. Note that BLACKWEL does not support isotopes. A line with measurable hyperfine structure is not suitable for use in constructing a Blackwell diagram.
The output from BLACKWEL has the format:
wavelength code vt Atot AHwhere vt is the microturbulent velocity, Atot is the abundance of the element represented by code on the abundance scale used by SPECTRUM, whereas AH is the abundance scale based on hydrogen. See §
for more information on these abundance scales.
BLACKWEL will prompt the user for input and output files, for a range
of microturbulent velocities and for a microturbulent velocity stepsize.
Thus, each spectral line in the input file results in a number of lines
in the output file. This output file can be used to plot a Blackwell
diagram. The
best lines to use to construct a Blackwell diagram are isolated (non-blended),
weak to moderate-strength lines on the linear and flat parts of the
curve of growth. Strong lines, especially those on the damping part of
the curve of growth, are not appropriate for a Blackwell diagram.
The only ``switch'' that can be used with BLACKWEL is the ``t'' switch
which alerts the program to the presence of an ATLAS9 header in the
stellar atmosphere model. See § .
The distribution for SPECTRUM comes with a GUI for use with BLACKWEL
(blackwell_sh.tcl). See
§ for more information on this GUI and more
practical information on how to construct and use Blackwell diagrams.