This section covers running SPECTRUM in its default mode. To learn how to run SPECTRUM in other modes in order to exploit its full power, please refer to later chapters in this document.
To run SPECTRUM in its default mode, three data files must be available.
The first of these is a stellar atmosphere model. Two of these
models have been provided in the SPECTRUM distribution, vega.mod
and sun.mod. It is also necessary to have an atomic and
molecular data file;
the one recommended for general use is stdatom.dat (provided in the
distribution). For this
exercise this file must be in your working directory, i.e. the directory
in which you unzipped SPECTRUM. Lastly,
you must have a linelist file. A number of these are available on
the SPECTRUM website. For this exercise, download luke.lst.gz.
Unzip this file with the command gunzip luke.lst.gz. This is a
large file and contains a few hundred thousand spectral lines. At
least for now, place this file in the directory in which you unzipped
the SPECTRUM distribution file. Now, confirm that you are in the directory
in which you unzipped SPECTRUM and
issue the following command at the linux prompt (>) and respond as
indicated:
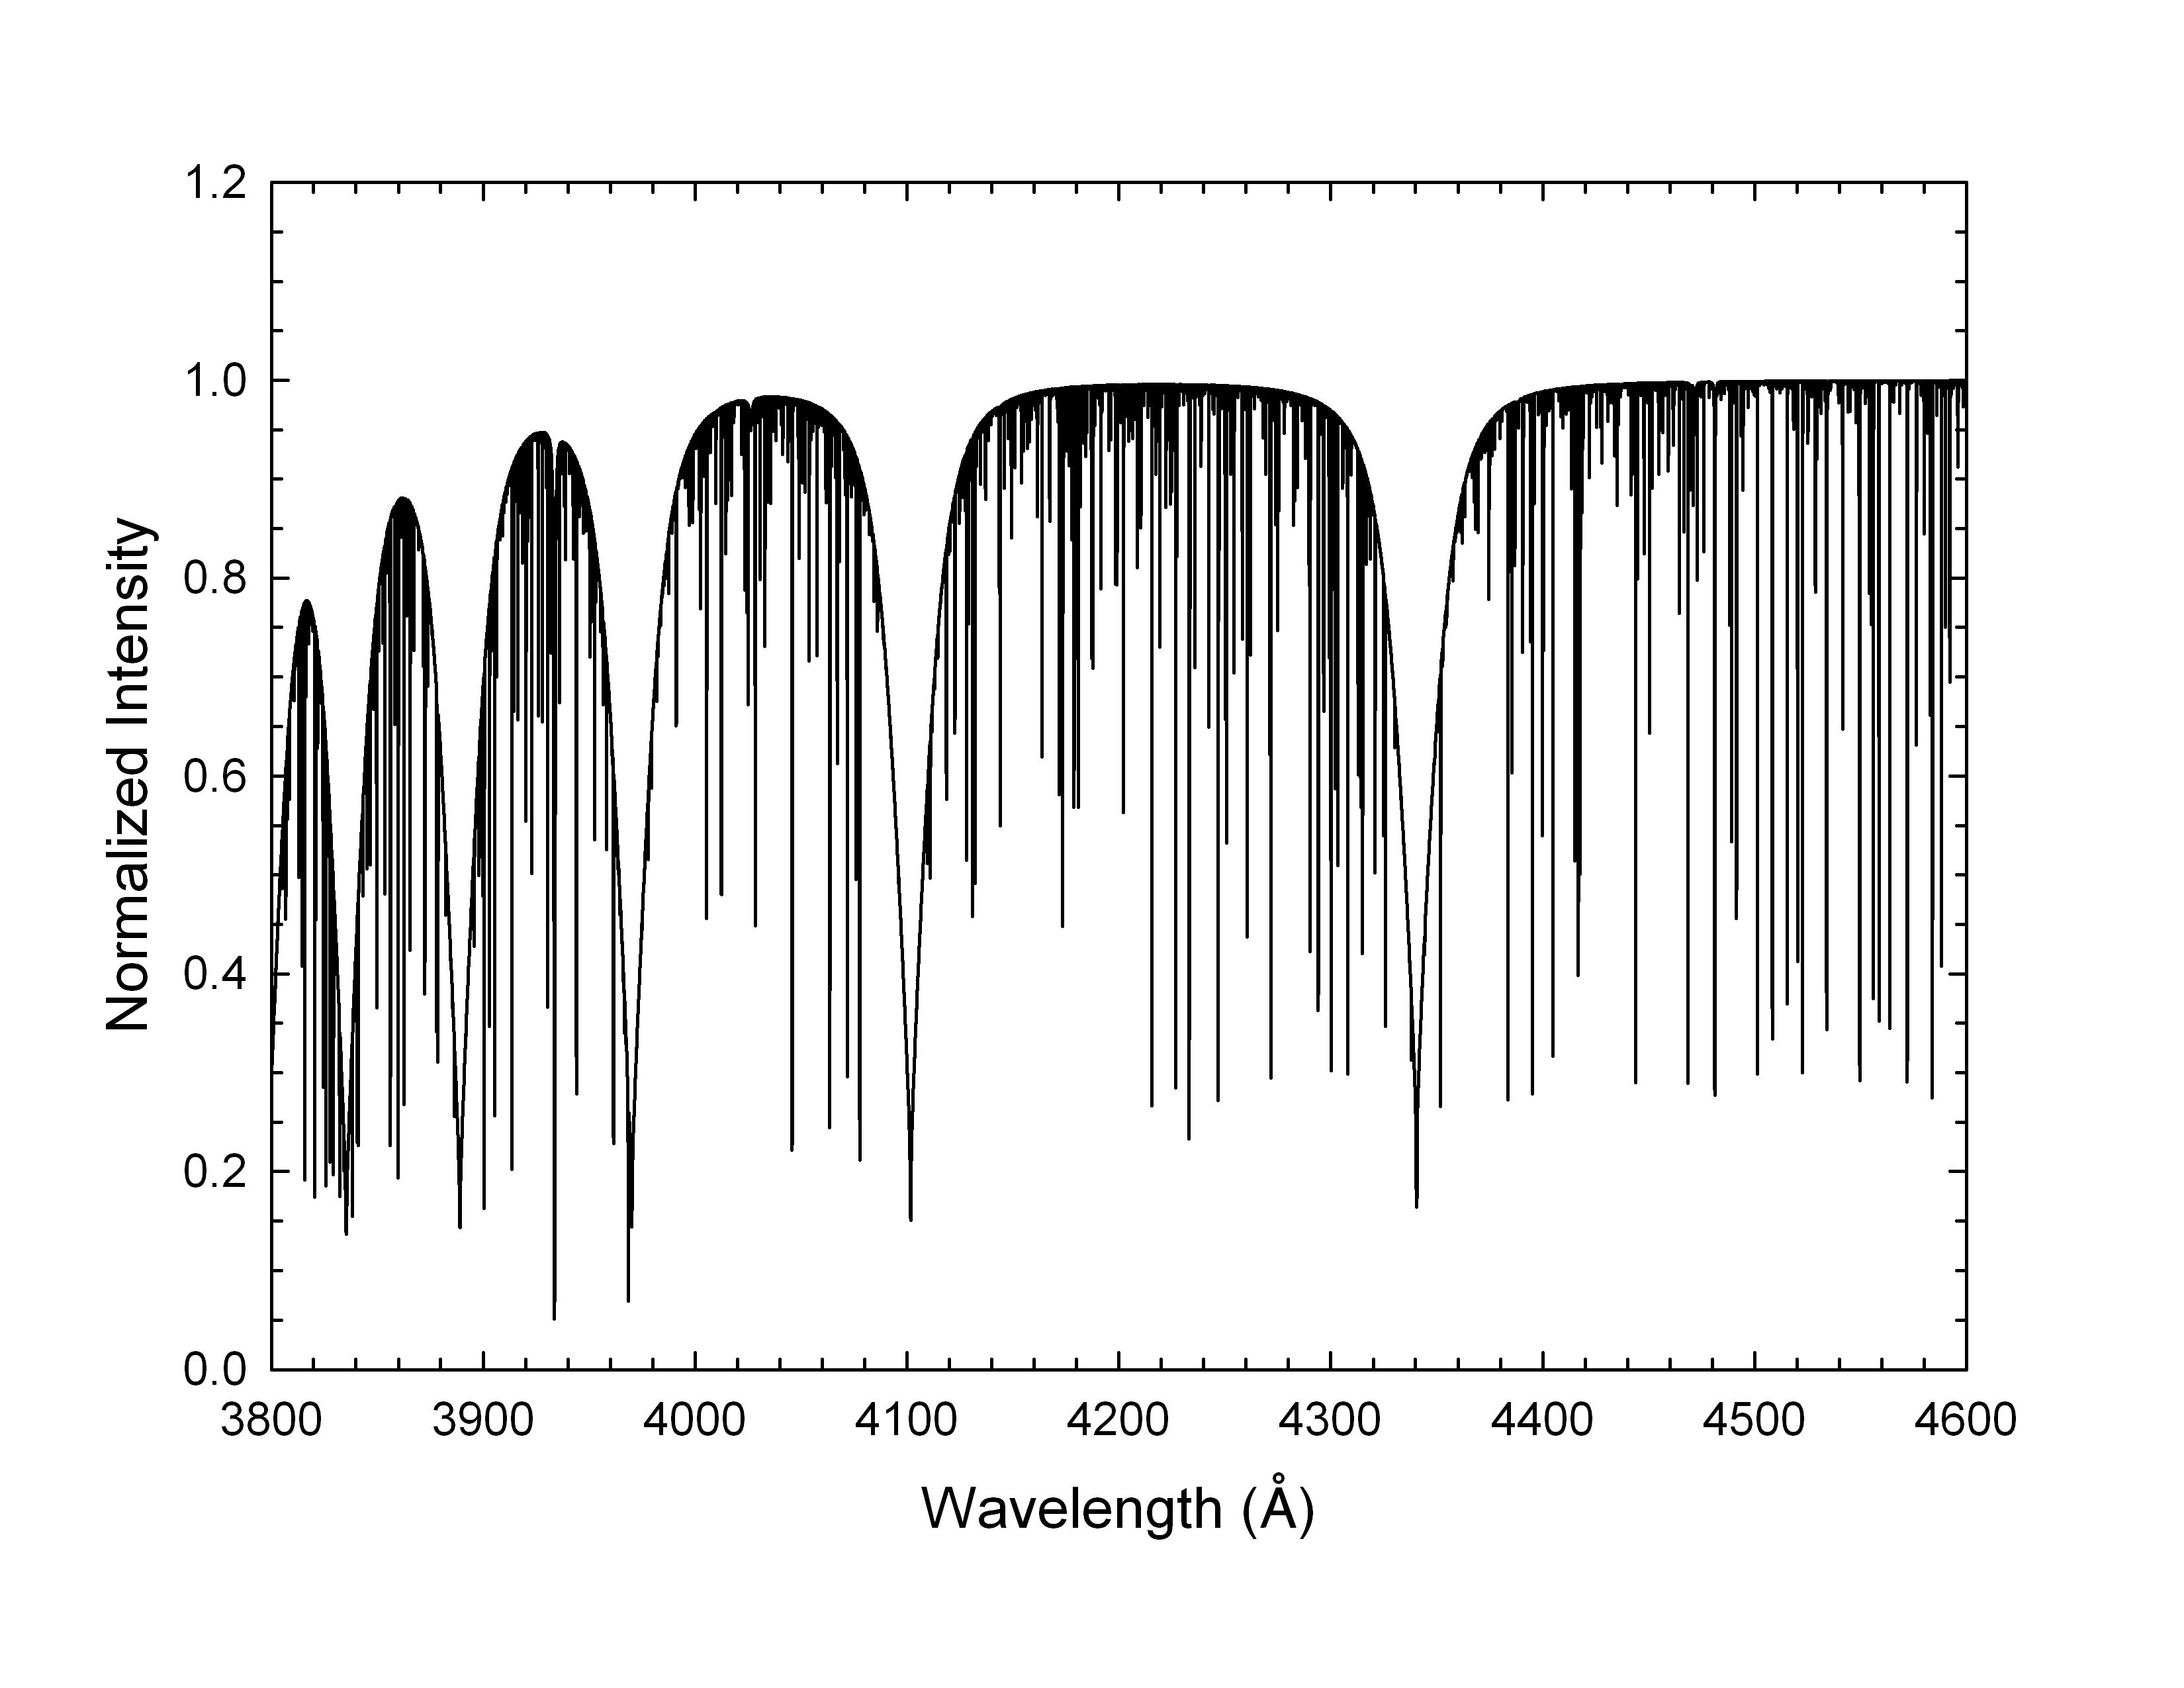
> ./spectrum

Enter name of stellar atmosphere data file > vega.mod

Enter name of linelist file: (default = luke.lst) > luke.lst

Enter name of output file > vega.spc

Enter microturbulence (km/s) > 2.0

Enter beginning and ending wavelengths (A) > 3800.0,4600.0

Enter wavelength step (A) > 0.02
At this point, SPECTRUM will take off and print to the screen the wavelengths from 3800.0 to 4600.0Å, with a spacing of 0.02Å. When it finishes (in a few minutes, depending on your machine), the output synthetic spectrum will be found in the ascii file vega.spc. This output file has a simple format: two columns with the wavelength in angstroms in the first column, and the normalized intensity in the second. It may be plotted on the screen with any plotting program, such as gnuplot and it should look like Figure
![[*]](crossref.png) . If your plot looks like Figure , then
SPECTRUM has been compiled correctly and is running properly.
. If your plot looks like Figure , then
SPECTRUM has been compiled correctly and is running properly.