Active Faulting in the Greater Los Angeles Region
Mechanical Earthquake Cycle Models of the Los Angeles Basin
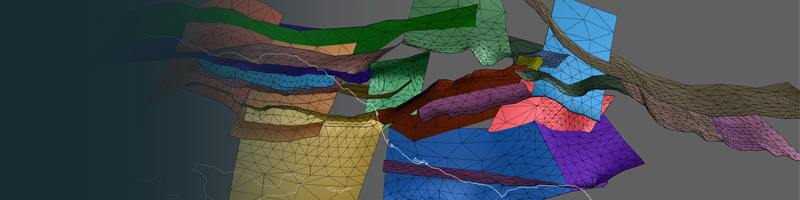
Along with my collaborators, Michele Cooke (UMass) and Susan Owen (Jet Propulsion Lab), we have created some of the first mechanical models of active tectonics in southern California that use non-planar, geologically representative fault surfaces. These complex non-planar surfaces are part of the Community Fault Model, compiled by the Southern California Earthquake Center. So far, we have compared results from these models to interseismic GPS data, geologic fault slip rates, fault slip distributions, and folding patterns. I am also interested in using physics-based models, similar to these, to predict reasonable bounds on earthquake recurrence intervals and maximum potential magnitudes.
The images below show some of our results...
Regional Fault Structure of the Greater Los Angeles Region
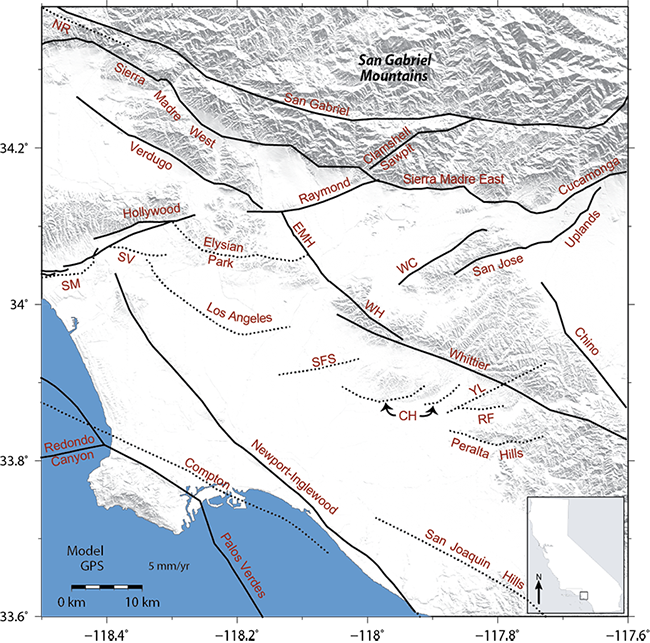
Above: Map showing approximate locations of active fault traces (black lines) of the greater Los Angeles region. Note the complexity and discontinuous nature of the fault structure. The upper tips of blind faults are indicated by black dashed lines. Fault abbreviations are as follows: EMH = East Montebello Hills, CH = Coyote Hills, NR = Northridge, RF = Richfield, SFS = Santa Fe Springs, SM = Santa Monica, SV = San Vicente, WC = Walnut Creek, and YL= Yorba Linda. For a three-dimensional interactive version of the modeled fault geometry, click here or visit my 3D Interactive Fault Models page.
Average Fault Slip Rates of Faults in Greater Los Angeles
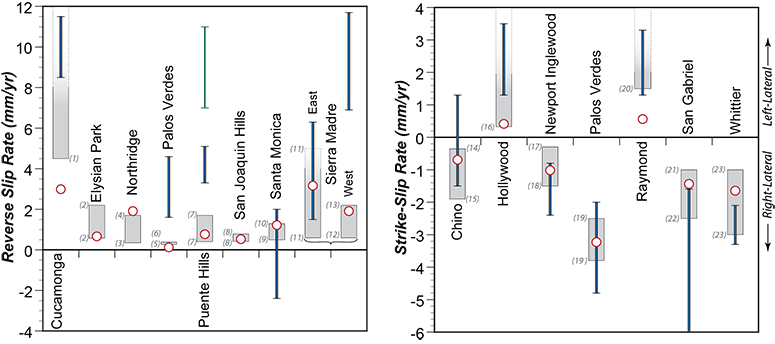
Above: Model-predicted average slip rates (red circles) and geologic slip rate estimates (grey rectangular ranges). Gradient shading on geologic ranges indicate that the upper limit is poorly constrained. To calculate the average slip rate of modeled fault surface containing many elements of varying size, we integrate the slip over each element’s area and calculate a weighted average slip rate for each surface. The Puente Hills reverse slip rate estimate of Argus et al. (2005) is shown with a green line, and slip rate estimates from the Meade & Hager (2005) block model are shown with thick blue lines. Note that the mechanical model fits geologic estimates of reverse slip rate better than existing models utilizing simplified fault structures. References for the upper and lower geologic slip rate ranges are shown by gray italic numbers and are given in Marshall et al. (2009).
3D Distribution of Fault Slip Rates
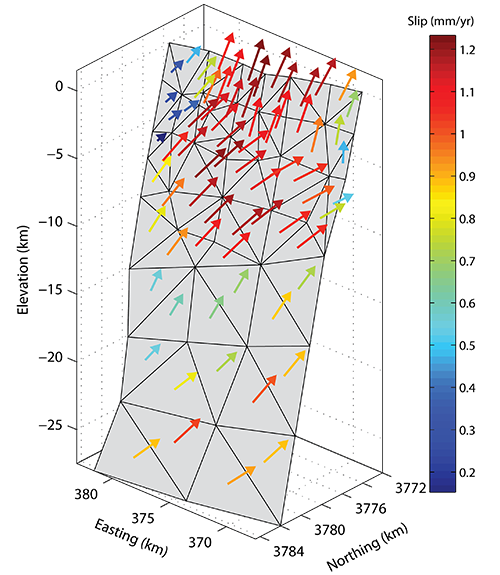
Above: Three-dimensional oblique view of the Hollywood fault. Arrows represent the net slip vectors on the hanging wall and are colored by magnitude of slip. Note that the slip vector rake changes significantly from the surface of the Earth (mostly reverse slip) to depth (oblique left-reverse slip). Thus, surficial investigations by geologists may mischaracterize the slip behavior of this fault. The complexity of the slip distribution arises in part to the fault's nonplanar geometry and interactions with nearby faults.
Comparison to Interseismic GPS Data
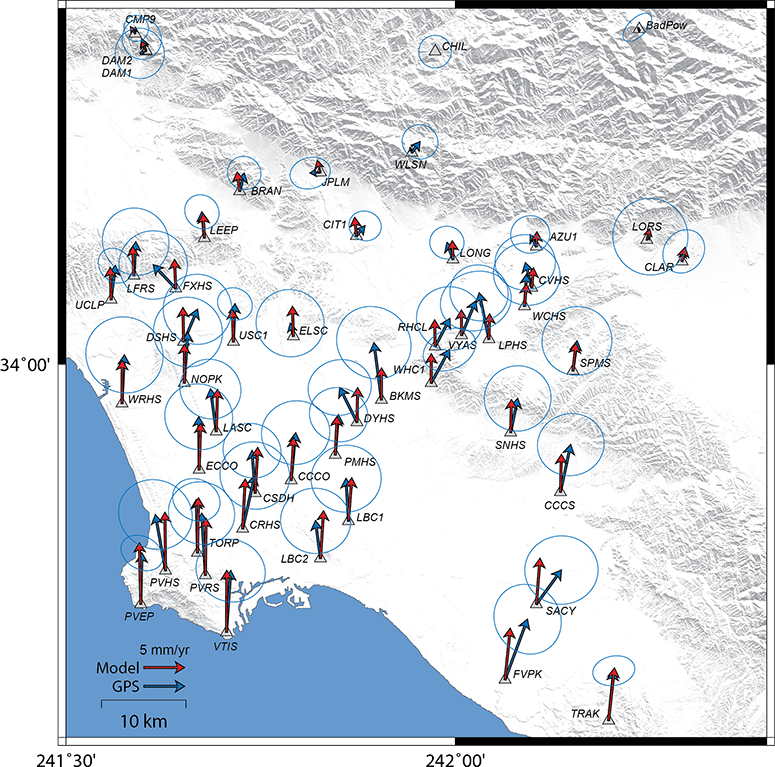
Above: Permanent GPS velocities (blue arrows) from Argus et al. (2005) and model-calculated interseismic velocities (red arrows) in the greater Los Angeles region. Errors (blue ellipses) in corrected velocities are given in Argus et al. (2005) with the 95% confidence ellipses shown here. Model results are shown for a locking depth of 8 km which minimizes the WRMS error (Figure 6) and matches all GPS velocities within the 95% confidence limits. The largest discrepancies arise near the Whittier Hills (sites BKMS WHC1, RHCL, VYAS, and LPHS), the San Joaquin Hills fault (near site FVPK and SACY), and at a site near the San Vicente and Hollywood faults in the northern Los Angeles basin (sites FXHS).