Miocene Faulting in Southeast Nevada
Field Mapping & Fault Mechanics of Lake Mead Fault System
Along with my collaborators, Simon Kattenhorn (University of Idaho) and Michele Cooke (UMass), we are using mechanical models to better interpret field observations of the interelationship between strike-slip and normal faults in the Miocene Lake Mead fault system. So far, we have shown a clear mechanical relationship between strike-slip and normal faults along the left-lateral Pinto Rige fault. We proposed that a preference for west-dipping normal faults, such as are observed at Pinto Ridge, indicates a west-dipping detachment fault at depth. Because the geometries of secondary normal faults at strike-slip fault tips can be used to infer the presence of the detachment we plan to get back out in the field and carefully map other near-tip regions of strike-slip faults the Lake Mead fault system to determine the spatial extent of the detachment.
The images below show some of our results...
Regional View of The Lake Mead Fault System
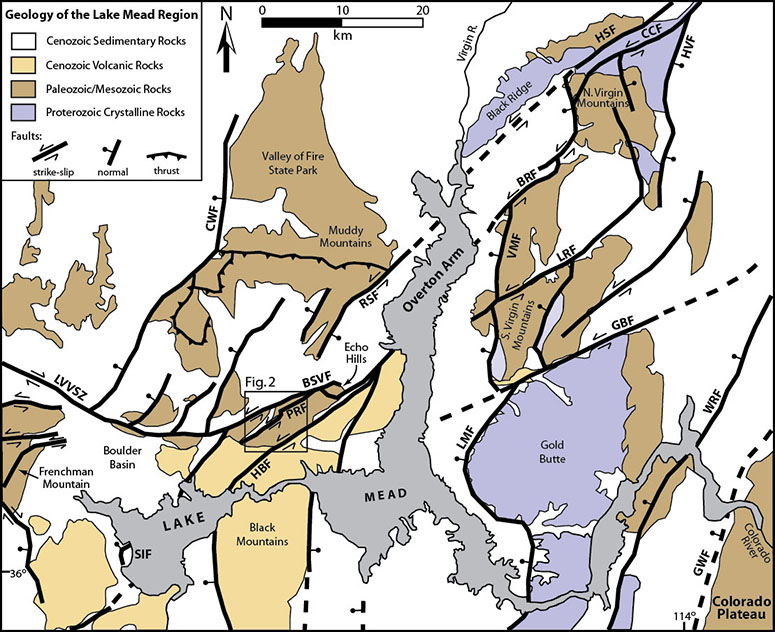
Above: Generalized geologic map of the Lake Mead region. The left-lateral faults in the center and
eastern portions of the map comprise the Lake Mead fault system. The exact location of many faults is somewhat
controversial, with this map having been adapted from Campagna and Aydin (1994), Duebendorfer et al. (1998),
and Faulds et al. (2001). Note that many of the Lake Mead strike-slip faults merge with west-dipping normal faults.
The boxed area shows the location of the Pinto Ridge study area of Marshall et al. (2010).
Fault names are as follows: BRF – Bitter Ridge fault; BSVF – Bitter Spring Valley fault; CCF – Cabin Canyon fault;
CWF – California Wash fault; GBF – Gold Butte fault; GWF – Grand Wash fault; HBF – Hamblin Bay fault; HSF – Hen Spring fault;
HVF – Hungry Valley fault; LRF – Lime Ridge fault; LMF – Lakeside Mine fault; LVVSZ – Las Vegas Valley shear zone;
PRF – Pinto Ridge fault; RSF - Rogers Spring fault; SIF – Saddle Island fault; VMF – Virgin Mountains fault; WRF – Wheeler Ridge fault.
Detailed Geology and Structure the Pinto Ridge Area
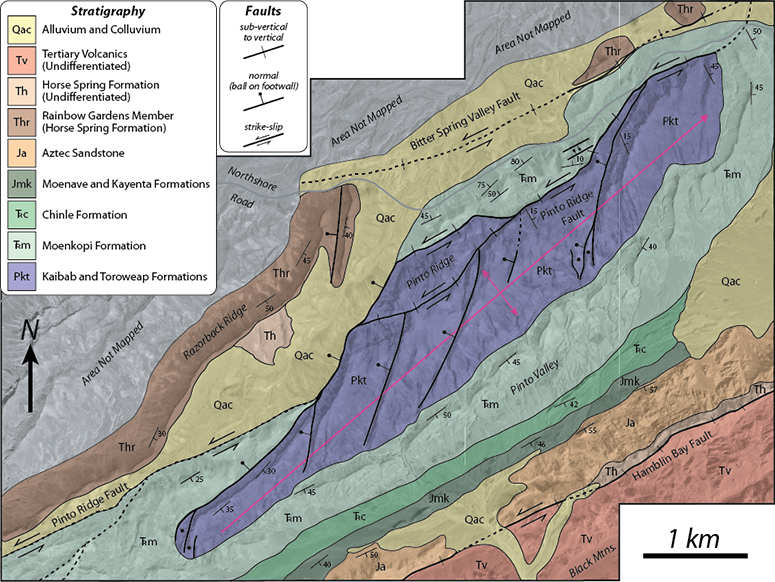
Above: Detailed geology, fault, and fold structure of the Pinto Ridge area. The pink line delineates the fold axis of the Pinto Ridge anticline. Note that the Pinto Ridge fault does not offset Qac, but because the fault creates a topographic escarpment, Qac tends to border the fault on the topographically low side. Also note that nearly all of the mapped normal faults dip westward.
Field Observations of the Pinto Ridge Fault
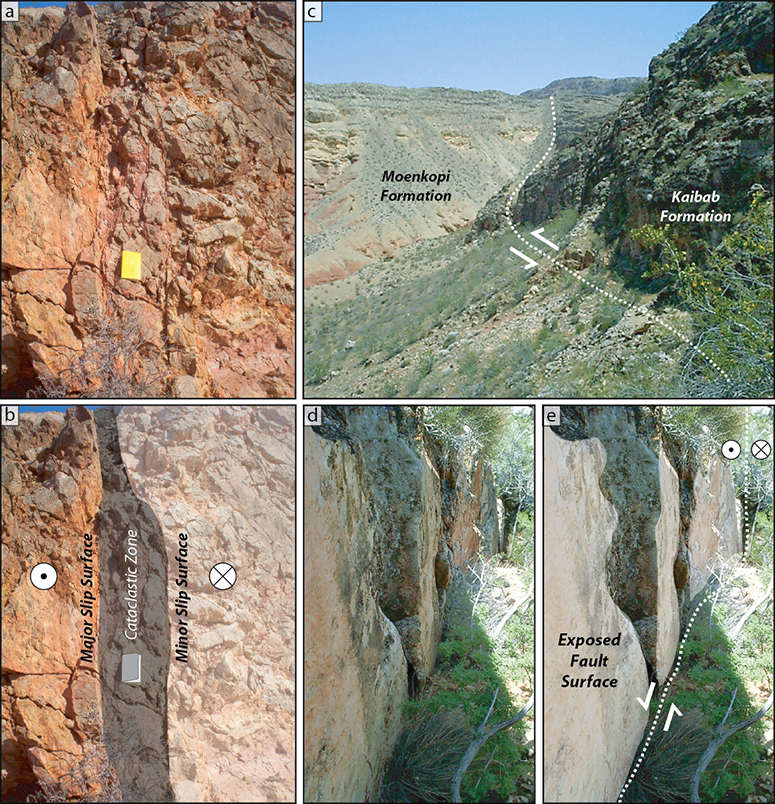
Above: Various views of the left-lateral Pinto Ridge fault.
(a-b) An exposure of the Bitter Spring Valley fault observed in a wash channel.
(c) panoramic view of the Pinto Ridge fault. Note the laterally-mismatched Kaibab and Moenkopi Formations.
(d-e) Exposure of the near-vertical Pinto Ridge fault surface.
View of a Secondary Normal Fault
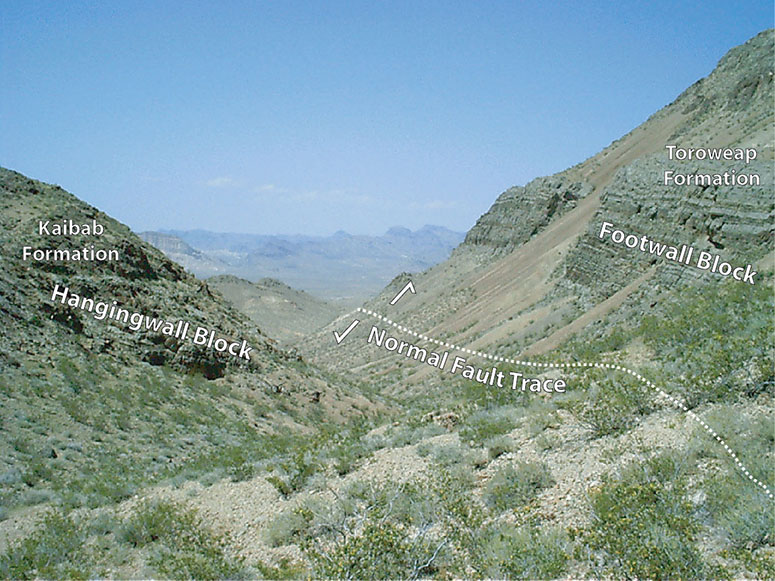
Above: View looking north towards the Pinto Ridge fault of a west-dipping secondary normal fault that we propose was formed by the perturbed stress field around the Pinto Ridge fault.
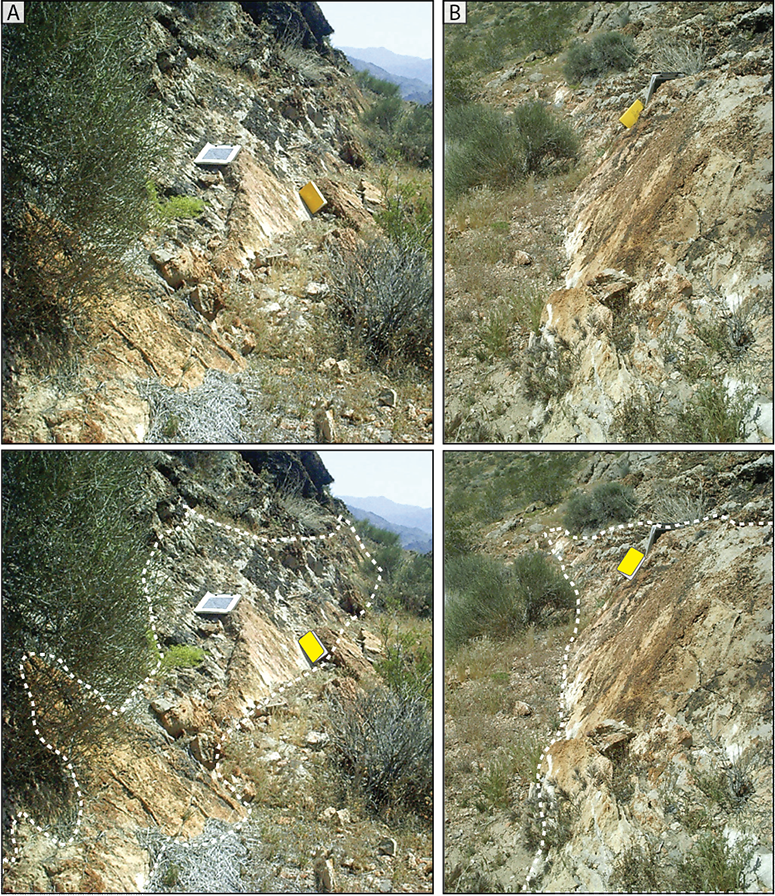
Above: Two tail faults mapped in the Kaibab limestone at Pinto Ridge. A field notebook (~20 cm tall) rests on the
fault surface in both photos. A dashed white line outlines the exposed fault surface.
(A) View approximately to the south.
(B) View approximately to the north. Both faults dip west at ~50-56°.
Other Field Examples of Secondary Fracturing
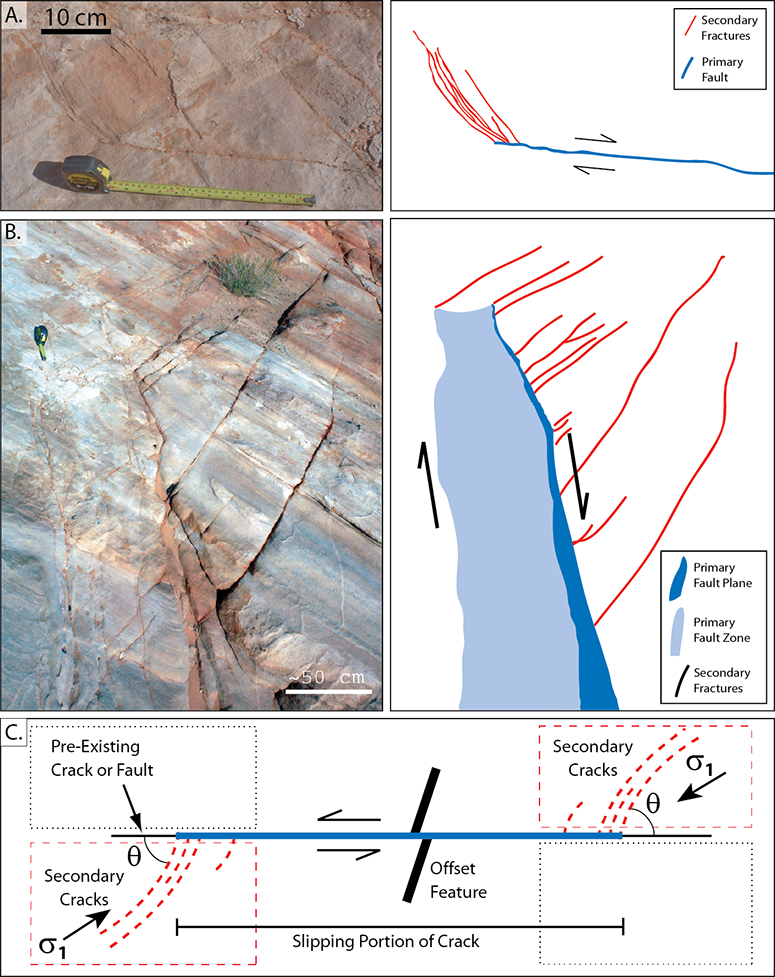
Above: Examples of cm to m-scale secondary fracturing around strike-slip faults in the Aztec Sandstone in the
Valley of Fire State Park, located ~25 km north-northeast of Pinto Ridge (see regional map above). This region, along with numerous
similar features, is discussed in detail by Myers et al. (2004) and Flodin and Aydin (2004).
(A) Plan view of a joint that has been reactivated by ~1 mm of right-lateral motion with numerous secondary cracks
oriented 30-50° from the primary joint trace.
(B) Oblique view of a 0.5-1.0 m-wide fault zone formed by the coalescence of numerous joints reactivated in right-lateral shear.
Slip on the through-going slip surface of ~8 cm resulted in the formation of numerous tailcracks oriented 60-70° from the fault slip surface.
The photo shows only the near tip region; the fault zone continues for many tens of meters past the lower edge of the photograph.
(C) Schematic illustration of the antisymmetric distribution of secondary deformation for the left-lateral case
(right-lateral case is the mirror image). The extensional quadrant is indicated by a dashed box while the contractional quadrant is
indicated by a dotted box. Take-off angle, θ, is measured away from the trend of the slipping fault and is predicted to be
~70° for pure strike-slip motion on frictionally-weak faults. Tailcracks are initiated in response to the local perturbation of
the regional stress field around a slipping fault and grow in a curved path towards parallelism with the remote
maximum compressive stress (σ1) direction.
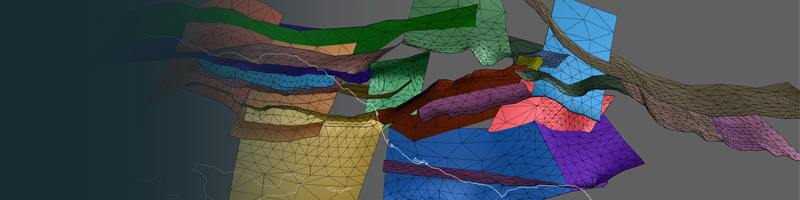
3D Mechanical Models of Perturbed Stresses Around a Strike-Slip Fault
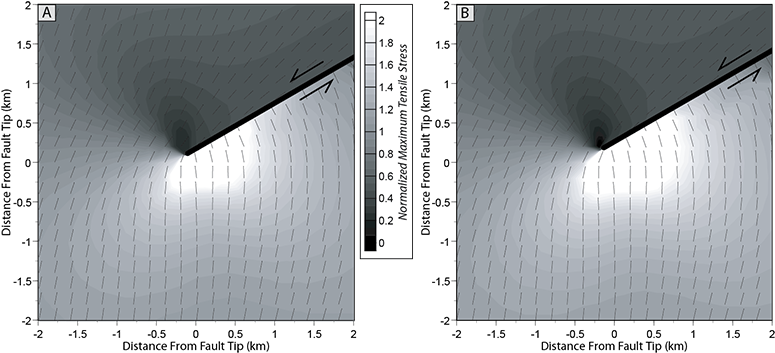
Above: Perturbed stress field at 4 km depth around a 10 km long left-lateral strike slip fault (fault shown with a thick black line).
Stress magnitudes are normalized by the magnitude of stress in a faultless model driven by the same remote strains. Therefore, any value greater
than one signifies an amplified tensile component of stress over the reference model. All normalized stress values exceeding a value of two are
plotted as white. Tick marks indicate the orientation perpendicular to the least compressive stress (σ3). Although the model does not
initiate and/or propagate faults, secondary normal faults should initiate in the extensional quadrant where stress values are high and propagate
parallel to the plotted tick marks.
(A) Model results for an 8 km tall strike-slip fault without an underlying detachment fault.
(B) Model results for an upper plate strike-slip fault that soles into a regional, 4° west-dipping detachment at ~8 km depth.
While the magnitudes of the perturbed stress fields vary, the general shape and character (i.e. stress orientations) remain similar
in both models implying that both isolated strike-slip faults and upper plate strike-slip faults should generate similar secondary features.
2D Mechanical Models of Interacting Normal Faults and a Basal Detachment
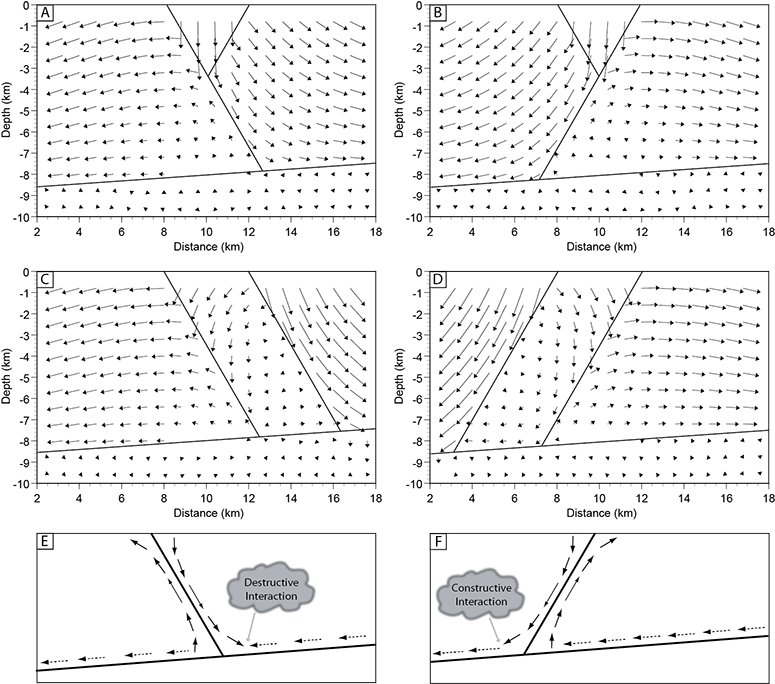
Above: (A-D) Displacement fields around various 2-dimensional modeled faults that sole into an ~8 km deep detachment.
Relative displacement magnitudes are shown by arrow lengths. Distance is plotted relative to the left edge of the model.
In general, west-dipping faults are most efficient when a west-dipping detachment is present. This is due to a decrease in gravitational
potential and a reduction in internal strain energy.
(E-F) Schematic sketch of a single fault merging into a west-dipping detachment with the near fault displacements conceptualized.
Both normal fault dips result in a reduced normal stress on the detachment due to motions on footwalls of normal faults; however,
west-dipping faults appear to be energetically favored due to constructive interference between motions on the hanging walls of west-dipping
normal faults and the upper plate of the detachment.