
Geophysical Analysis of Fluvial Terraces along the South Fork of the New River, NC
Jesse Dean || 2011-2012
Jesse used Ground-Penetrating Radar (GPR) and direct-current electrical resistivity to determine the alluvial stratigraphy and depth-to-bedrock of four stream terraces between 0.9 and 21.6 m above the South Fork of the New River in Ashe County, NC. Each terrace consists of a bedrock bench that is broadly horizontal, buried by up to 7.5 m of alluvium. The results of his work were compared to two models of terrace formation: the cut-in-fill and strath models. Although both types have the same surface profile, they are differentiated by the thickness of alluvium, thus geophysical imaging was crucial to determine the formation mechanisms of these fluvial terraces.
Location of Study: Ashe County, NC
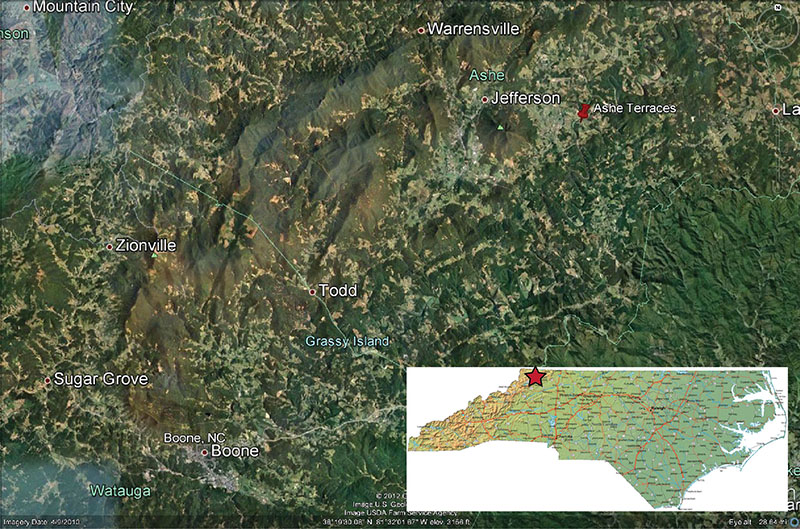
Above: Location of study area with fluvial terraces. The push-pin marks where the terrace set is located relative to surrounding towns. Image courtesy of Google Earth.
Terrace Distribution Map, Locations of Geophysical Transects, and Trench Locations
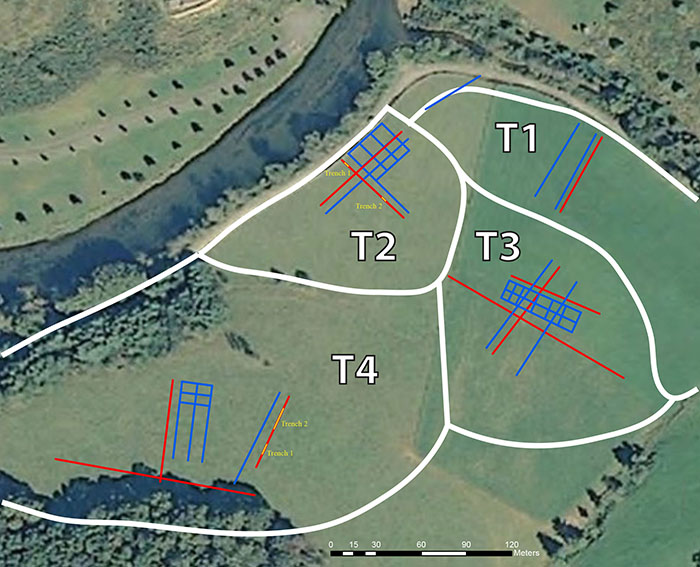
Above: Location of and distribution of fluvial terraces (denoted by thick white curves) along the south fork of the New River. T1 is the lowest terrace (closest in elevation to modern river level) and T4 is the highest. Red lines show site where resistivity surveys were conducted, blue lines show GPR surveys, and yellow lines show locations where trenches were excavated with a backhoe. Image courtesy of Google Earth.
Near-Surface Geophysical Data
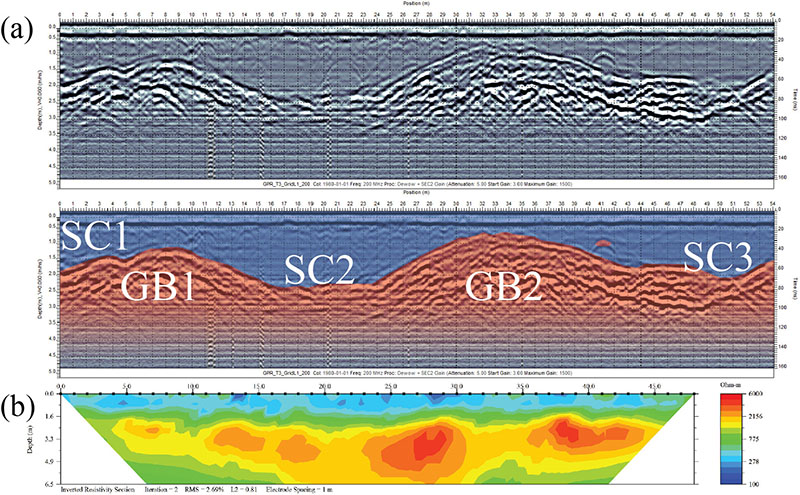
Above: a) GPR profile of the upper NW-SE trending T3 grid profile (Figure 18).
b) Resistivity profile of the upper NW-SE trending T3 grid profile (See image below or terrace map above).
a) and b) are scaled to match each other horizontally. SC 1-3 and GB 1-2 correspond to the stream channels and gravel bars found in the surface grid below.
3D Interpolation of Geophysical Data
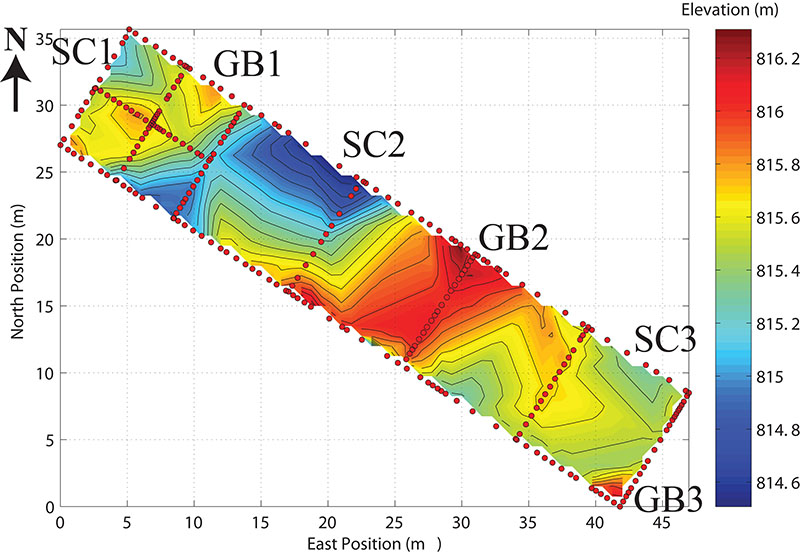
Above: Contour plot of the top surface of the gravel bars (see figure above) interpolated from GPR transects collected on the T3. Source data points are shown with red dots. Elevation is meters above sea level. SC 1-3 are stream channels and GB 1-3 are interpreted as gravel bars that appear in the surface. This data clearly resolves three northeast/southwest trending stream channels in the subsurface.