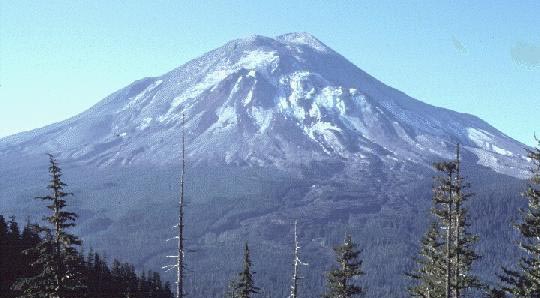
May 17, 1980, before the eruption. (Courtesy USGS, photo by Harry Glicken)
Click here or on image for view of Mt.
St. Helens after the eruption.
May 17, 1980, before the eruption. (Courtesy USGS, photo by Harry Glicken)
Click here or on image for view of Mt.
St. Helens after the eruption.
Mount St. Helens, located in southwest Washington State, is a typical stratovolcano. The volcano is one of several that line-up to form the Cascade Range, which extends from northern-central California northward into the Province of British Columbia in Canada. Six of the volcanoes are shown below in relationship to the convergent plate boundary separating the Juan de Fuca and North American plates.
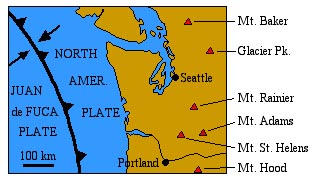
2.1 Approximately how far is Mount St. Helens from the convergent plate boundary separating the Juan de Fuca and North American plates?
Mount St. Helens, like the other volcanoes of the Cascades, is composed of andesitic and rhyolitic pyroclastic materials. Some of the pyroclastic material has been remobilized as landslides and lahars. As explained at the beginning of this lab exercise, eruptions of stratovolcanoes can be catastrophically explosive. In May, 1980, Mount St. Helens did just that. The images at the top of this page show the state of the mountain before and after the May, 1980 eruption.
Let's take a closer look at the relationship between andesitic/rhyolitic volcanism and a convergent plate boundary. Below you can examine a larger scale map of the area, and an east-west cross-section (A-A') from the plate boundary to Mount St. Helens. For the purpose of comparison, the scale is the same as the scale used on the map and cross-section of the Island of Hawaii.
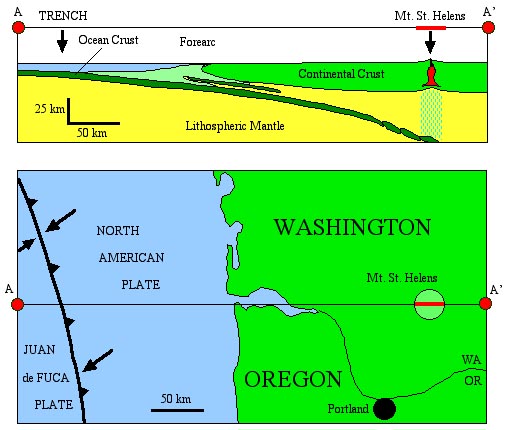
Stratovolcanoes are typically circular in plan, about the size of the circle shown on map. The radius of Mount St. Helens is about 6 km at the base, and the elevation of the base is about 1 km above sea level. Before the eruption of May, 1980, the elevation at the top of Mount St. Helens was about 3 km.
2.2 Using this information, and modeling the stratovolcano as a simple cone-shape, estimate the volume of volcanic material in Mount St. Helens, in cubic kilometers (km3). To remind you, the volume of a cone is given by the following formula,
volume = (1/3)*pi*r2*h,where pi ~ 3.14, r = radius of the cone, and h = height of the cone.
2.3 How does this compare with the volume of a shield volcano, as exemplified by the Island of Hawaii?
The cross-section (above the map) shows the relationship between the convergent plate boundary and the volcanism. In the case of Mount St. Helens, like the other stratovolcanoes of the Cascades, the production of the andesitic/rhyolitic magma is ultimately related to the subduction of the Juan de Fuca plate beneath the western edge of the North American plate. Oceanic crust of the Juan de Fuca plate and sedimentary material (light green) are being shoved downward, toward the east, underneath North America. This down-going material undergoes metamorphism as it becomes exposed to progressively higher pressures and temperatures in the interior of the earth beneath North America. Earthquakes generated near the top surface of the down-going Juan de Fuca plate originate at a depth of about 75 km beneath Mount St. Helens. That's about where the top of the Juan de Fuca plate is located directly beneath Mount St. Helens. Temperatures at these depths can be as high as 1200 C, hot enough to cause some partial melting of the metamorphosed basalt of the subducting oceanic crust. The metamorphism also releases volatile (gas) components such as H2O, CO2, and SO2. The relatively small amounts of basaltic magma and rather large amounts of volatile gasses migrate upward, ultimately encountering the base of the overlying continental crust. Here, the basaltic magma and volatile gasses contribute to partial melting of the base of the continental crust. The magma thus formed is andesitic and rhyolitic, reflecting the composition of the lower part of the continental crust. Generally, only very small amounts of the basaltic magma ever reach the surface. The greater part of the basaltic magma becomes mixed, sort of homogenized, with the andesitic/rhyolitic magma. This andesitic/rhyolitic magma readily dissolves, quite literally soaks up, the volatile components. Under the very high pressures at such depths near the base of the continental crust these dissolved gasses are effectively trapped in the magma. However, the buoyant, gas-charged magma tends to work it's way upward toward the surface (intrusion). Most of the andesitic/rhyolitic magma cools and crystallizes before it ever reaches the surface, forming sometimes vast plutonic (intrusive) bodies of granodiorite/granite. Only comparitively small amounts of the gas-charged andesitic/rhyolotic magma ever reach the surface, but when this happens - LOOK OUT! The rapid formation of gas bubbles in the magma and their explosive expansion can have catastrophic effects. See the "before eruption" and "after eruption" images of Mount St. Helens, at the top of this page.
2.4 How might these "vast plutonic bodies of granodiorite and granite" ever become exposed at the surface? (Hint: Rock Cycle)
Now, let's take a closer look at the physiography (shape) of a stratovolcano. In the case of Mount St. Helens, this makes for an interesting "before" and "after" study of the effects of a eruption. Below, you can examine "before" and "after" topographic maps of Mount St. Helens.
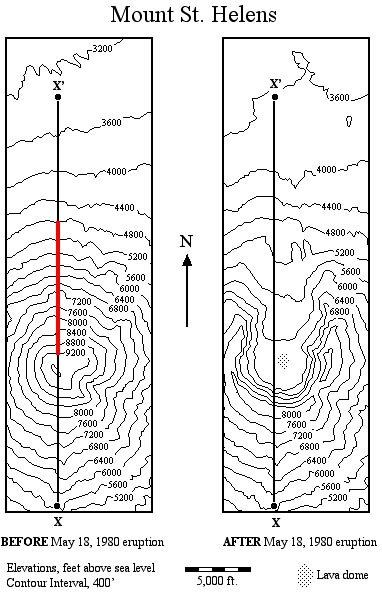
Before the May 18, 1980 eruption, Mount St. Helens was a simple cone-shaped stratovolcano, typical of very many stratovocanoes around the world. The elevation at the top was 9677 ft (~3000 m). Oops, I apologize here for getting away from the metric system in these maps and some you will see later. The unit of measure is "feet" in all of the existing maps from which these were constructed. For what you will have to do, this won't make any difference. So you will be doing your work in "feet."
The slope of the flanks of a stratovolcano are pretty much controlled by the angle of repose of the coarser pyroclastic material making up the greater part of the volcano.
2.5 What is the slope and angle of the slope of the surface of Mount St. Helens along the red bar in the "before" map above? The length of the red bar is 10,000 ft.
2.6 How does this compare with the slope and angle of slope of flanks of a shield volcano?
One way to examine the effects of the eruption is to construct "before" and "after" topographic profiles of the volcano. The diagram below shows how this is done for a topographic profile along the segment X-X' (marked on the maps above) for Mount St. Helens before the May 18, 1980 eruption.
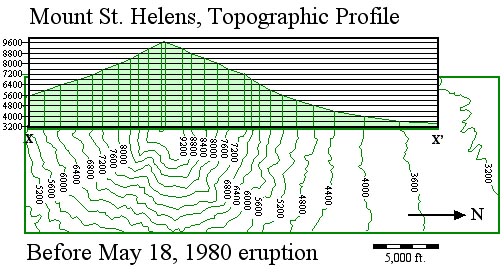
Basically, the topographic profile shows how the elevation changes along a specified line on the map, here X-X'. It's just a graph of elevation (vertical axis) versus horizontal distance (horizontal axis). It should come as no surprise to you that this just makes a side-view of the mountain. O.K., so now you know what Mount St. Helens looked like before the eruption, when viewed from the east. Wouldn't you like to know what Mount St. Helens looked like just after the eruption, from exactly the same vantage point?
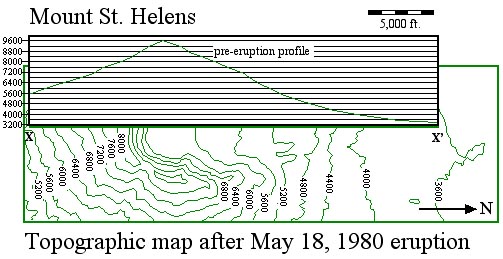
2.7 Well, get to work. Construct the post-eruption profile on the hand-out of the map shown above. The pre-eruption profile is shown for comparison.
2.8 On your copy of the post-eruption profile, mark the following regions, (1) where there has been no change, (2) where material has been removed, and (3) where material has been added (deposited).
2.9 As nearly as you can estimate, what is the thickness of pyroclastic material (mostly ash) that has been deposited at the spot marked X'? The best way to do this is to estimate the elevation at X' on the "before" and "after" maps, then subtract.
The amount of material that was removed from Mount St. Helens has been estimated at 6.5 km3 (cubic km). Most of this material was old volcanic material that was part of the volcano before the eruption. Some of this pulverized pyroclastic material was carried aloft and to the east by the wind, where it settled on the ground in noticeable amounts as far away as Montana. In Idaha, some 500 km east of Mount St. Helens, volcanic ash blanketed the landscape in a layer up to 5 mm thick.
2.10 The amount of material (6.5 km3) that was removed from Mount St. Helens represents what percentage of the original volcano? (Help: You need your answer to item 2.2.)
There is another way to examine some of these changes, by superimposing the "before" and "after" topographic maps. Take a look.
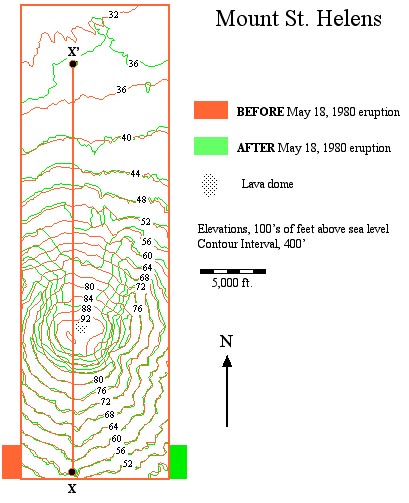
In these superimposed topographic maps you can identify basically three kinds of regions, (1) where the contour lines superimpose nearly exactly, (2) where the contour lines don't coincide and the "after" elevations are higher than the "before" elevations, and (3) where the contour lines don't coincide and the "after" elevations" are lower than the "before" elevations.
2.11 What does it mean if the "after" elevations are higher
than the "before" elevations?
(HINT: no change, material added, material removed.)
2.12 What does it mean if the "after" elevations are lower
than the "before" elevations?
(HINT: no change, material added, material removed.)
2.13 On your copy of this map, shade in the three regions. If you have color pencils or markers, use the following scheme for shading in the different regions. Regions of type 1, "no difference," leave blank. Regions of type 2, green. Regions of type 3, red.
Based on this kind of analysis, it becomes obvious that the explosion of the Mount St. Helens and dispersal of pyroclastic material was not the same in all directions.
2.14 In what direction was the explosion directed? What is your reasoning?
NOW YOU HAVE COMPLETED THE SECOND PART OF THE LAB EXERCISE.
PROCEED TO THE NEXT SECTION ON THE SOUFRIERE HILLS,
MONTSERRAT
or
RETURN TO FIRST PAGE