Maps and Other Cool Visualizations of Earth Science Data
Scott T. Marshall | Department of Geological and Environmental Sciences
A key focus of my research involves computational models of earthquake-producing faults and the processing and analysis of satellite data. As part of this work, I write code to automate the creation of maps and other visualizations of geodata. This approach blends data science principles with Earth sciences, or what I like to call "geodata science." On this page, I will occasionally share examples of maps and other geodata visualizations that I believe may be of interest. All maps are produced with the open source Generic Mapping Tools software package, with code written by my students and me. Below, you can see some of the results that these geodata science skills can produce!
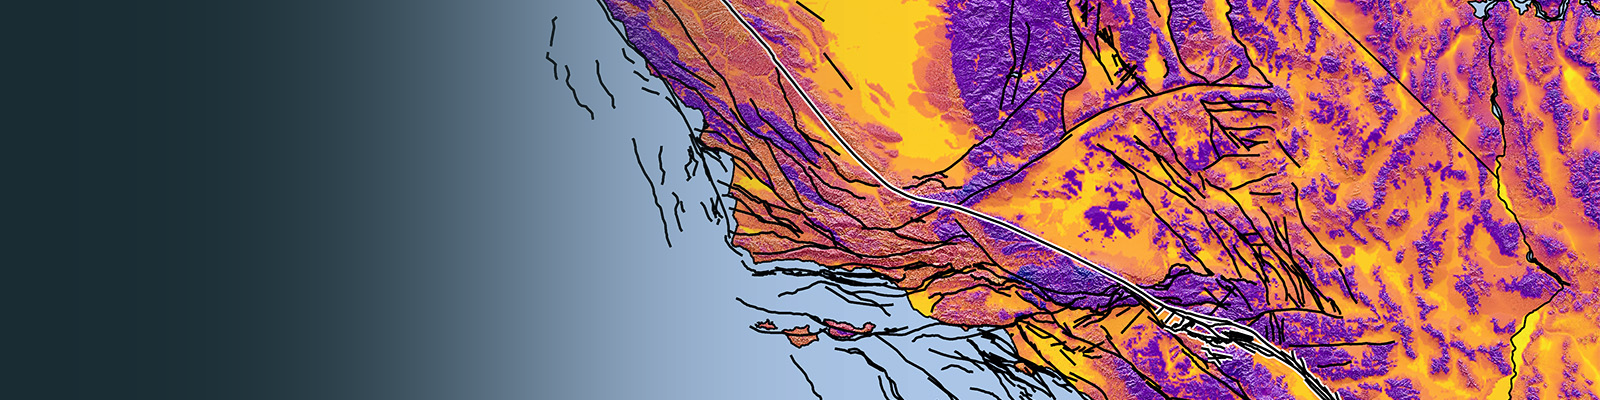
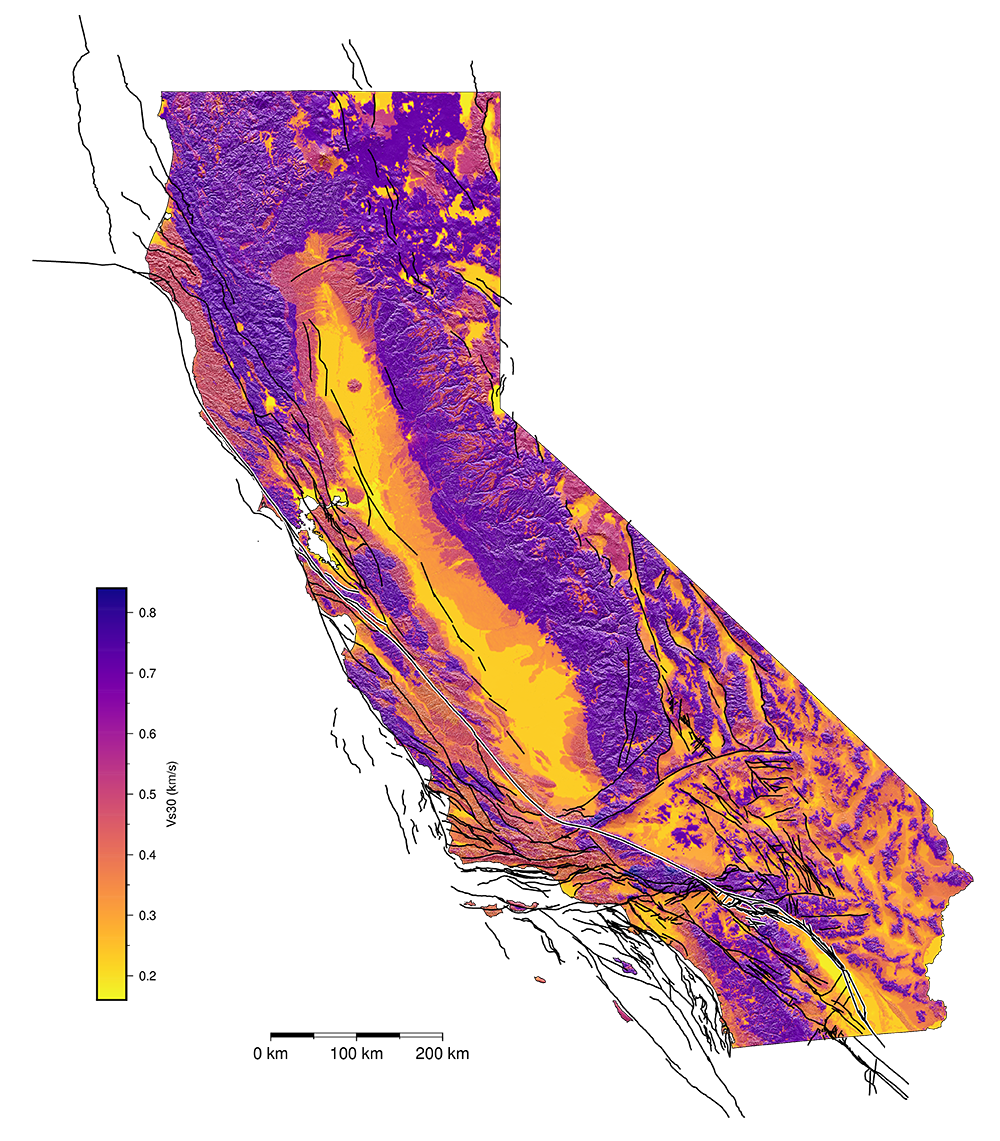
A Visualization of a Vs30 Model and Faults in California
Downloads
8.5 in wide --> PDF [27.3 MB] --> PNG [13.5 MB]
The speeds that seismic waves travel are important to know as they partly control how much shaking different locations
will experience. Perhaps the most important of these wave speeds are in the shallow subsurface where our buildings sit.
I made a version of this data visualization for the 2024 annual meeting of the Statewide California Earthquake Center (SCEC).
The colors show the Vs30 model by Eric M. Thompson (2022) and are shaded
by the USGS 3DEP Digital Elevation Model, while black lines show fault traces from
the SCEC Community Fault Model version 7.0.
The faults of the San Andreas system are highlighted. For this visualization, I wanted to only show California,
so the map is cropped to the CA state border. Cool!
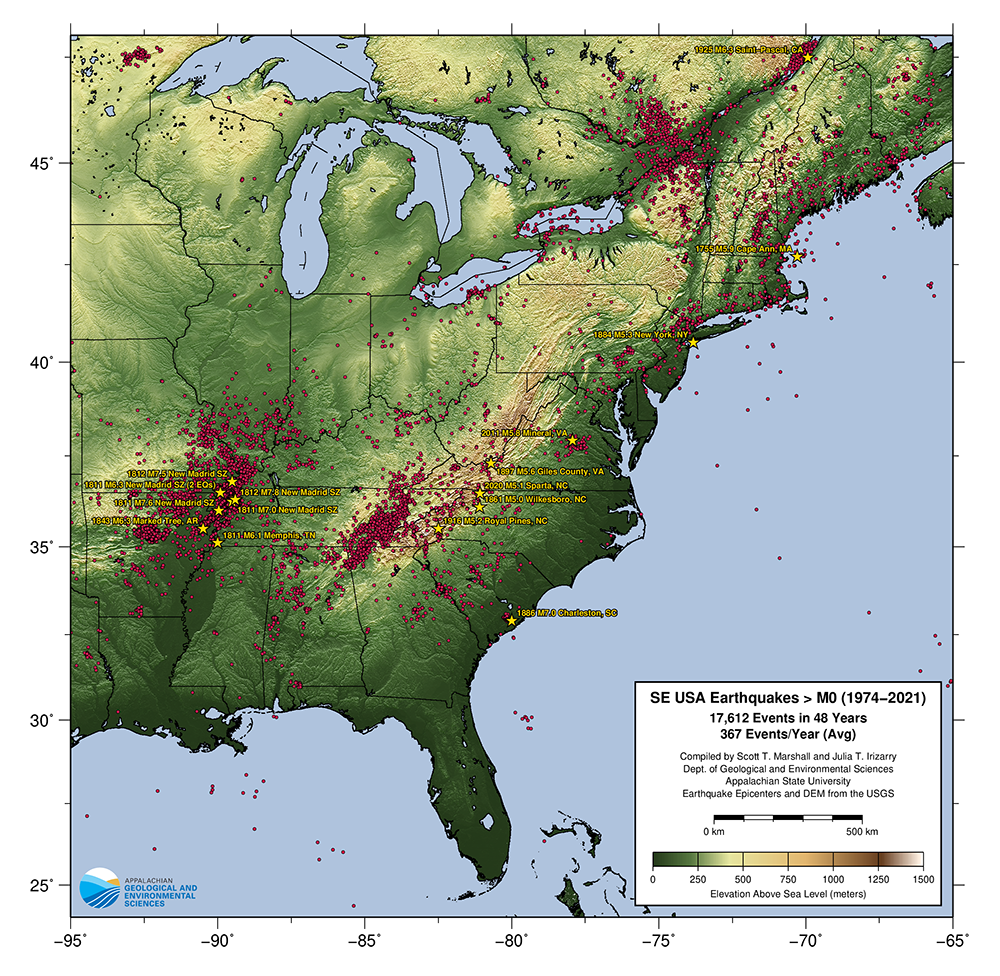
Earthquakes in the Eastern United States (1974-2021)
Downloads
42.5 in x 42 in (poster-sized) --> PDF [150 MB]
8.5 in wide --> PDF [19.9 MB]
--> PNG [7.3 MB]
Many years ago, Julia Irizarry, an undergraduate quantitative geoscience major, worked with me to write a script that produced a large map
of Eastern US seismicity. The map turned out to be quite useful, so I have since added new data and processed an improved DEM for the map.
The updated map includes all earthquake epicenters > M0 from the Advanced National Seismic System catalog
from 1974-2021. Yes, zero magnitude events are still earthquakes! Due to the logarithmic scaling of magnitude, zero or even negative magnitudes
are possible. The 2011 M5.8 Mineral, Virginia, the 2020 M5.1 Sparta, North Carolina, and other significant historical Earthquakes are highlighted
with gold stars on the map. The two most historically dangerous seismic zones in the eastern US are the New Madrid Seismic Zone
(near the Tennessee-Missouri-Arkansas tri-state border) and the Middleton Place-Summerville Seismic Zone (near Charleston, SC).
The two map insets (only on 42 in map) highlight these seismic zones. In the 48 years of data plotted here there were
17,612 earthquakes (about 367 events per year). Compare this to the southern California map shown below where the much smaller southern
California region averages nearly 18,000 earthquakes per year, which is approximately what the entire eastern US sees over the 50 years.
So, while the eastern United States does have earthquakes often, it is not at the level of an active tectonic plate boundary.
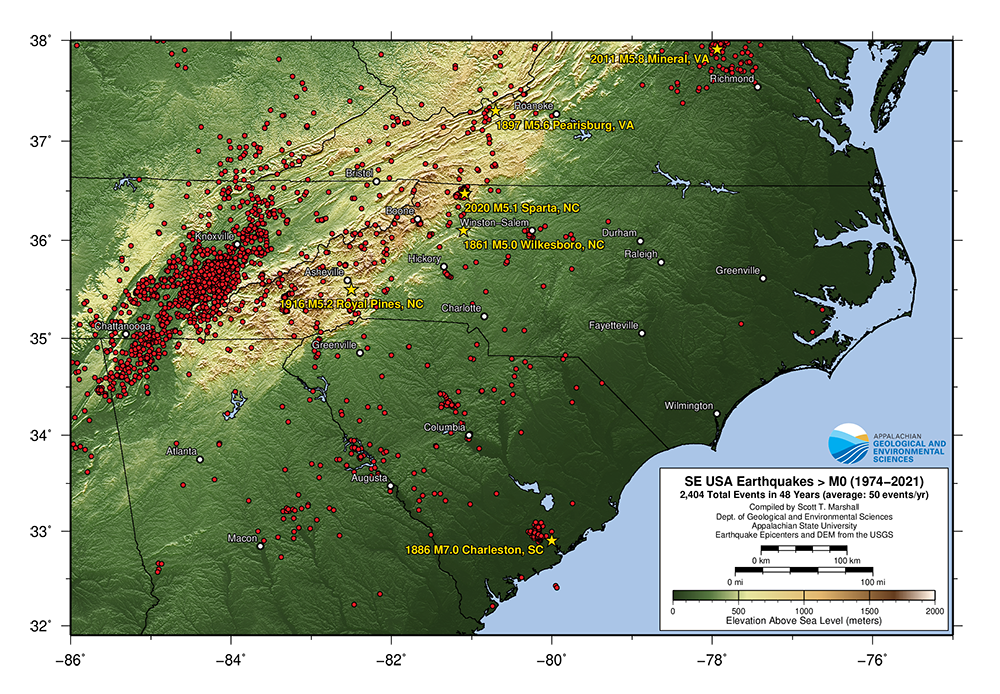
Earthquakes in the Southeastern United States (1974-2021)
Downloads
8.5 in wide --> PDF [14.8 MB] --> PNG [6.5 MB]
The map above shows essentially the same data as the eastern US earthquakes map shown above on this page, but is focused on the Carolinas.
The map includes all earthquake epicenters > M0 from the Advanced National Seismic System
catalog from 1974-2021. Significant historical Earthquakes are highlighted with gold stars on the map. The most seismically active region
is the Eastern Tennessee Seismic Zone (ETSZ), the cause of which is not fully understood. While the ETSZ has the largest number of events,
most of these are small (< M2) and are not felt by humans. In the 48 years of data plotted here there were
2,404 earthquakes (about 50 events per year).
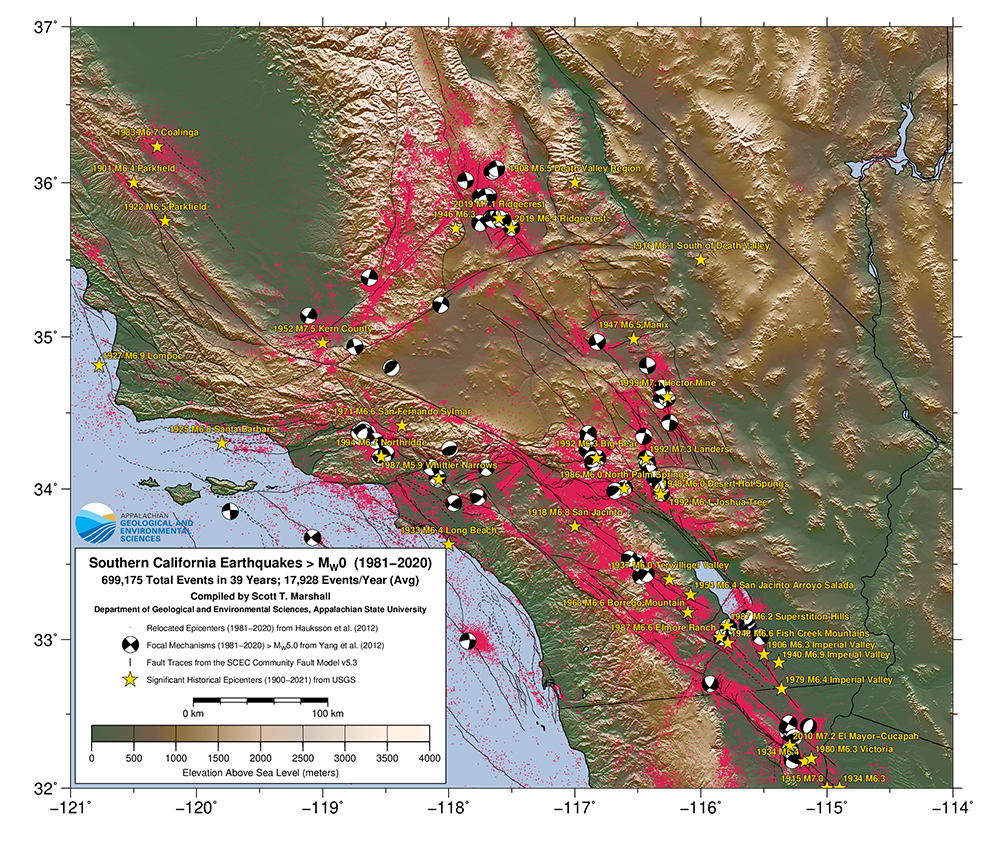
Earthquakes in Southern California (1981-2020)
Downloads
49 in x 42 in (poster-sized) --> PDF [106.7 MB]
8.5 in wide --> PDF [37.8 MB]
--> PNG [7.7 MB]
The map above shows relocated seismicity (> M0) in southern California from 1981-2020. Undergraduate geology major, Colin Ferebee and I
originally wrote the code for this map back in 2009, but nearly all of the data sources have changed since then, so this is a completely
updated map of relocated seismicicty in SoCal. What is "relocated seismicity"? To determine earthquake locations, we need a model
of subsurface seismic wave velocities at every point in the subsurface. The locations estimated by the USGS typically use a simplified
velocity model. The seismicity here has been "relocated" by
Hauksson, Yang, and Shearer using a more detailed
velocity model with other accuracy enhancements. Focal mechanisms are from
Yang, Hauksson, and Shearer. Historical events are
from the Advanced National Seismic System catalog. Fault traces are from the
Southern California Earthquake Center
Community Fault Model version 5.3.2.
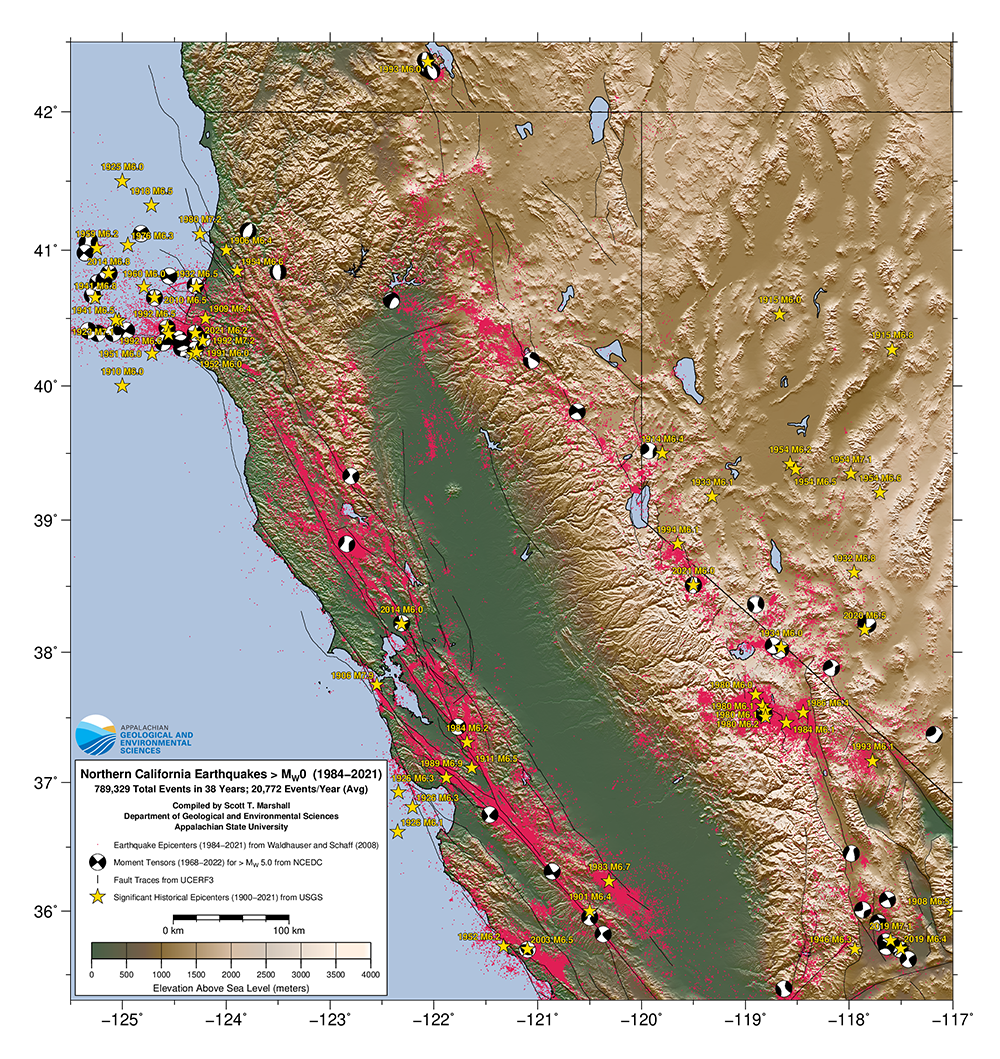
Earthquakes in Northern California (1984-2021)
Downloads
49 in x 42 in (poster-sized) --> PDF [76.1 MB]
8.5 in wide --> PDF [41.8 MB]
--> PNG [8.6 MB]
The map above shows relocated seismicity (> M0) in northern California from 1984-2021. Undergraduate geology major, Colin Ferebee and I
originally wrote the code for this map back in 2009, but nearly all of the data sources have changed since then, so this is a completely
updated map of relocated seismicicty in Northern California. What is "relocated seismicity"? To determine earthquake locations, we need
a model of subsurface seismic wave velocities at every point in the subsurface. The locations estimated by the USGS typically use a simplified
velocity model. The seismicity here has been "relocated" by
Waldhauser and Schaff using a more detailed
velocity model with other accuracy enhancements. Focal mechanisms are from
the Northern California Earthquake Data Center (NCEDC). Historical events are
from the Advanced National Seismic System catalog. Fault traces are from the
Uniform California Earthquake Rupture Forecast version 3 (UCERF3).