Geodetic Measurement of Crustal Deformation in Southern California
Global Positioning System (GPS) and Interferometric Synthetic Aperture Radar (InSAR)
Along with my collaborators, Gareth Funning (UC Riverside), and Susan Owen (Jet Propulsion Lab), We have been processing and using GPS and InSAR data to measure deformation patterns and rates in the western Transverse Ranges of California. This is a region of ~30 active faults that have complex geometry and most likely mechanically interact with each other. The region was also home to the 1994 M6.7 Northridge earthquake, which was one of the most costly natural disasters in U.S. history. The main goals of this work are to:
- Characterize periodic seasonal motions in the GPS data
- Determine if the geodetically measured motions are contaminated by anthropogenic activity (groundwater removal and/or petroleum production)
- Remove the effects of the San Andreas Fault, so only the local deformation is shown
- Map out spatial variations in strain rates using the corrected GPS data
- Create a mechanical model of the complex fault network based on the Southern California Earthquake Center (SCEC) Community Fault Model (CFM)
- Compare the mechanical model results to the geodetic measurements
GPS Timeseries Analysis and Spatiotemporal Filtering
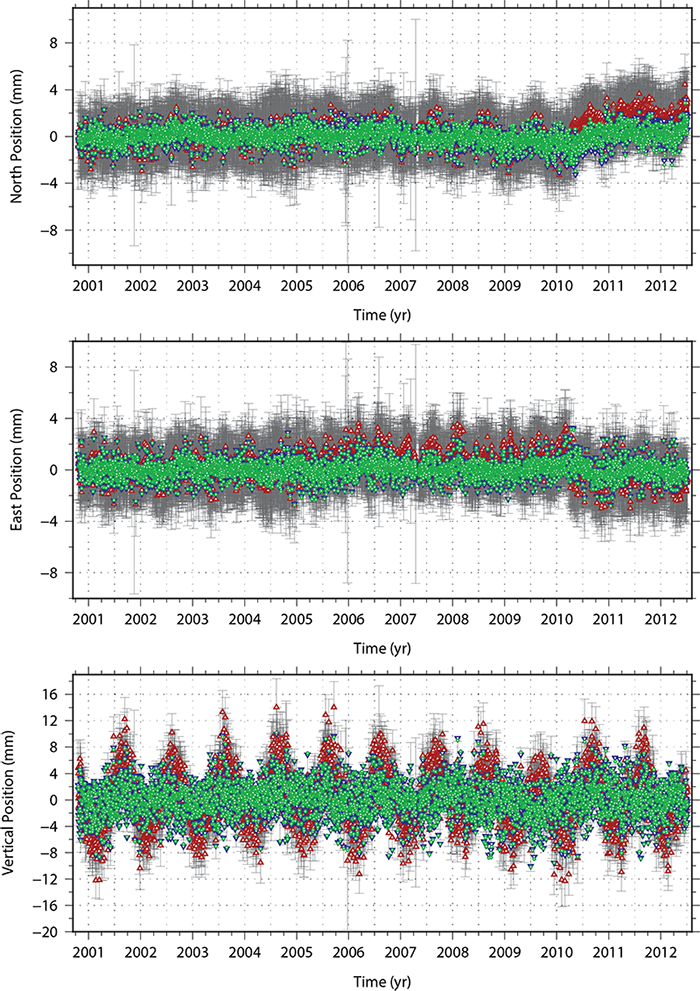
Above: Example of GPS time series processing results for site CIRX. Each component (North, East, & Vertical) of motion is detrended and is shown separately. Red triangles show the raw MEaSUREs combined filtered time series, blue inverted triangles show the time series after removal of bias, offsets (coseismic, orbital, and equipment changes), and the green circles show the final time series after removal of common mode error via principal component analysis (i.e. Dong et al. 2006). Because the MEaSUREs filtered time series already has the network-wide common mode errors removed, it is not surprising that the common mode filtering does not significantly alter most time series. The weighted RMS error (WRMS) for this site was reduced from 2.14 to 1.45 mm/yr, and the average WRMS for all sites was 2.67 mm/yr for the raw data and 1.86 mm/yr for the final processed time series data. In the end, the resultant time series are dominantly linear suggesting successful removal of non-tectonic motions.
Removal of Strain Associated with the San Andreas Fault
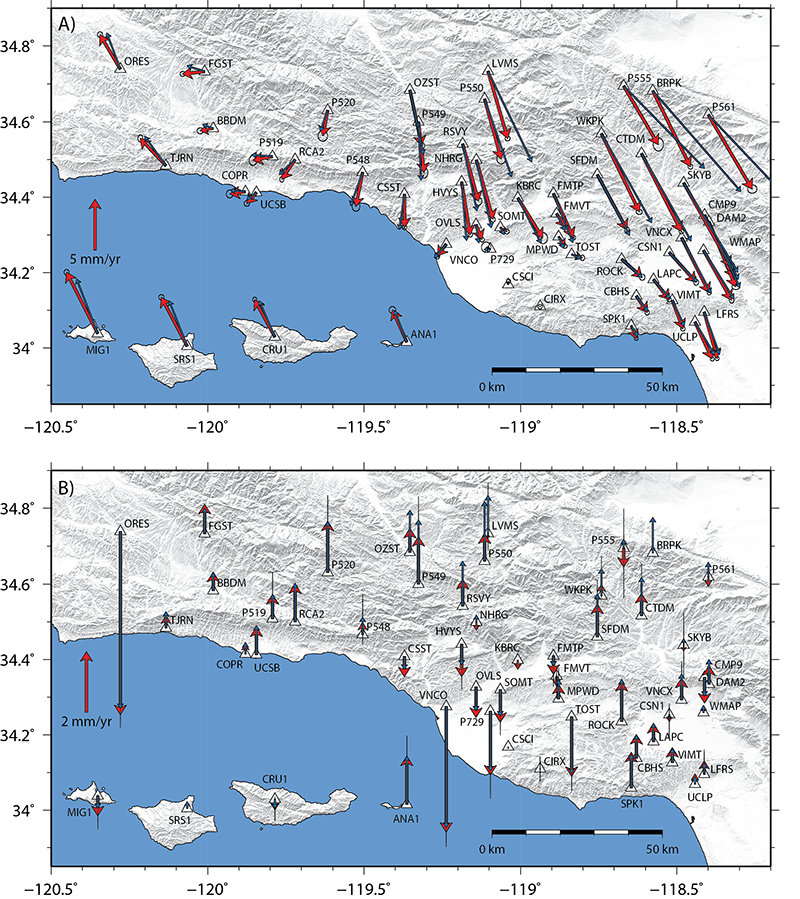
Above: GPS velocities relative to site CIRX. Velocities before San Andreas strain removal are shown with the thinner blue arrows
while the GPS velocities with strain due to the locked San Andreas fault removed are shown with red arrows. 1σ error bars are plotted,
but because most time series are rather long (> 10 years) and have nearly continuous data, the formal errors are very small
(typically < 0.2 mm/yr).
A) shows the horizontal velocities.
B) shows the vertical velocities.
Persistent-Scatterer InSAR and Continuous GPS Data
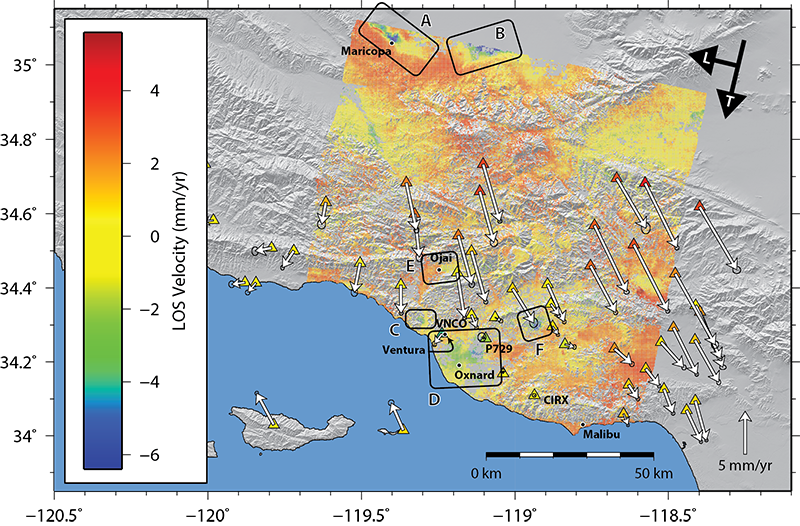
Above: Persistent Scatterer Interferometric Synthetic Aperture Radar (InSAR) data from the Envisat satellite shows Line of Sight (LOS) motion of the ground in southern California (Marshall et al., in review). The along track direction direction is shown with the thick "T" arrow (descending orbit) and the look direction is shown with the "L" arrow. Negative values are away from the satellite (often implying subsidence). This map shows several localized regions with non-tectonic anthropogenic motions (black boxes). Continuous GPS sites from the Plate Boundary Observatory are shown with triangles and white arrows. All velocities are relative to site CIRX and the GPS velocities have the effects of the San Andreas fault removed.
Strain Rate Mapping Using GPS Data
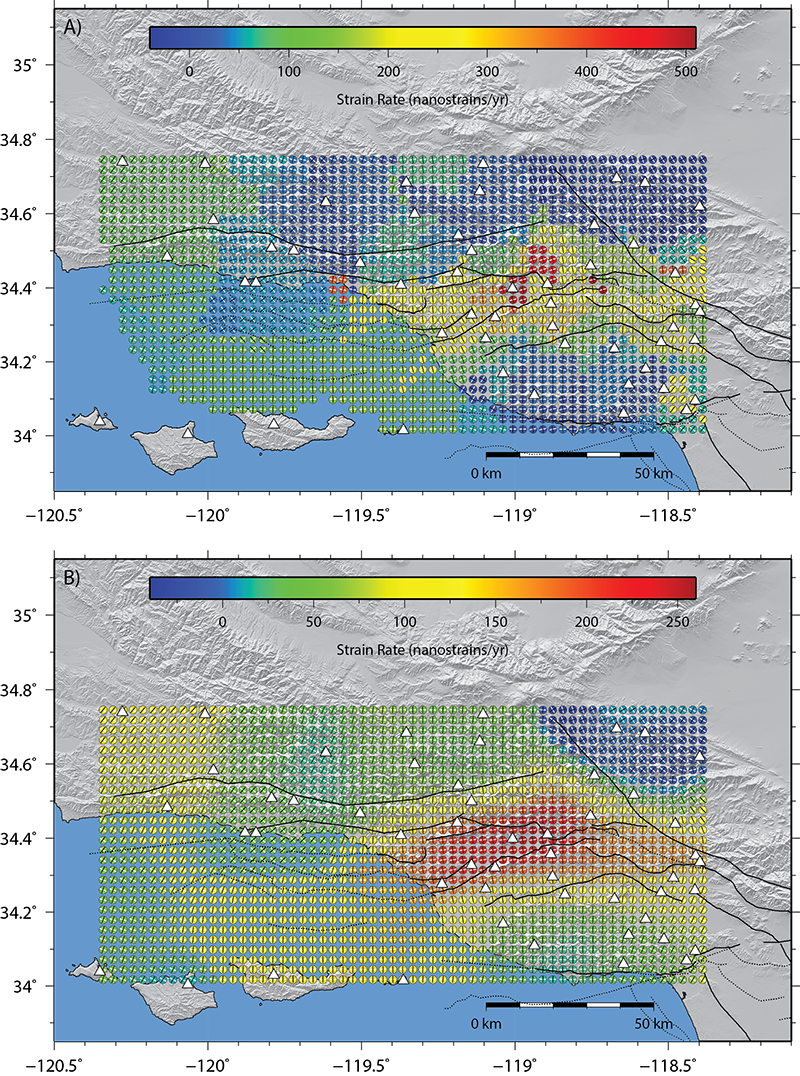
Above: Maximum principal contraction rates and directions throughout the western Transverse Ranges calculated from inversions of
the corrected horizontal GPS velocities. Fault traces are shown with black lines, and GPS site locations are plotted as white triangles.
Black tick marks show the direction of maximum principal contraction while white tick marks show the directions of maximum principal extension.
A) A nearest neighbor interpolation and a least squares inversion of the GPS velocities.
B) A distance weighted inversion.
Both inversions highlight that fast contraction rates are localized near the central Ventura basin, generally follow the trend of the basin,
and decrease to the west and east.
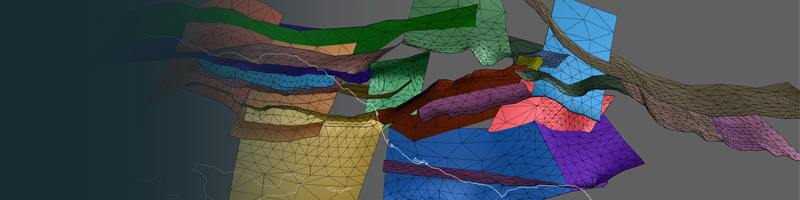
Comparison GPS Velocities to Interseismic 3D Mechanical Models
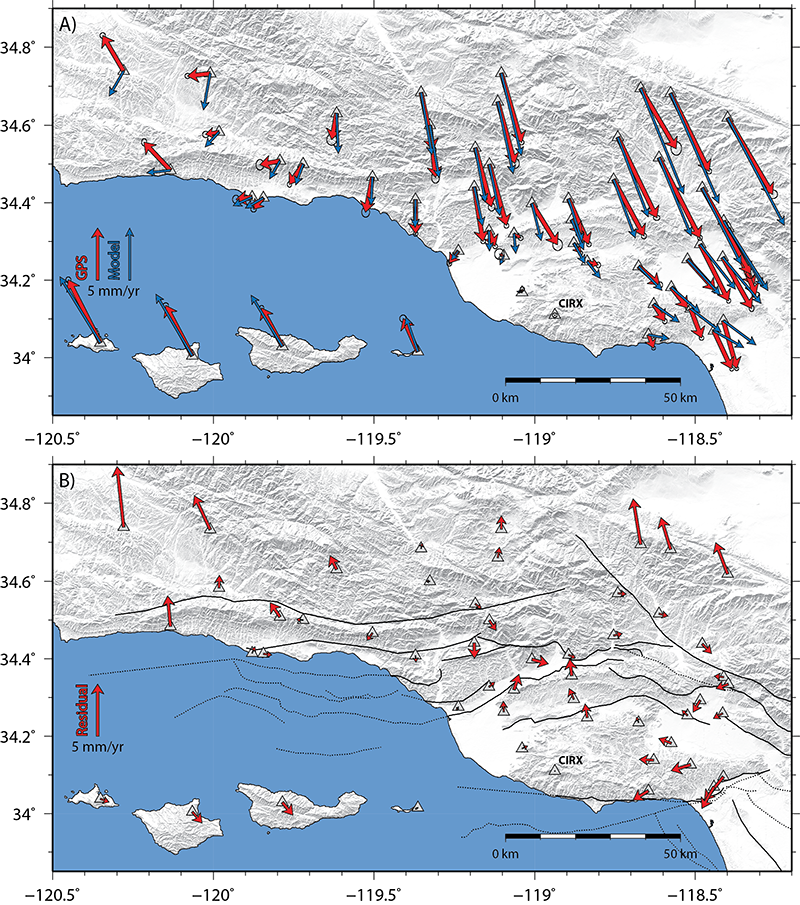
Above: A) Comparison of corrected interseismic GPS velocities (red arrows) to predictions from the 3D mechanical model
with a best-fitting 13 km locking depth (blue vectors). All velocities are shown relative to GPS site CIRX.
B) GPS-model residuals for the same 13 km locking depth model. Fault traces are shown with black sinuous lines that are dotted where blind or offshore.
Note that in general, the model reproduces the GPS velocities well, with largest areas of misfit occurring near the edges of the region
to the northwest, northeast, and southeast. The model does not produce sufficiently fast velocity gradients across the Ventura Basin,
a result that is expected because the model does not incorporate low rigidity sediments in the Ventura basin (e.g. Hager et al. 1999).